Description
Develop functionality to edit decimal places on charts and graphs, instead of only just columns
Use Case and Business Need
Hello!
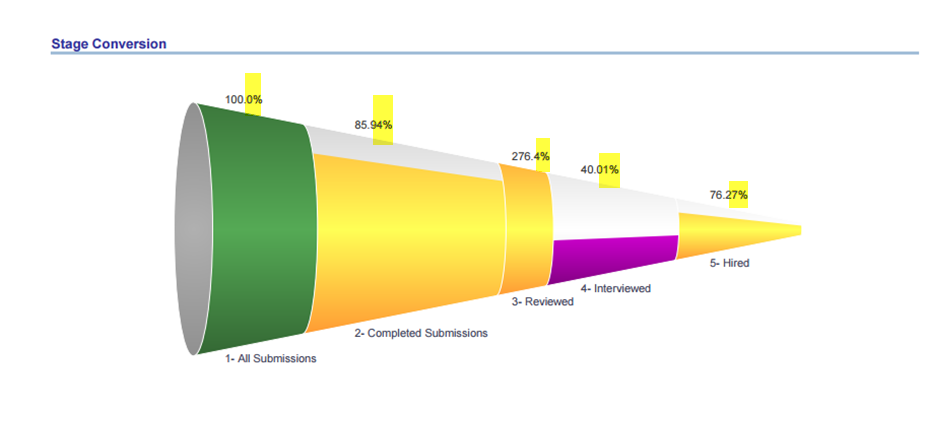
Currently when you build reports, you can edit the decimal settings via column formatting. In one instance, we set it to remove decimal points. If you change your view of your report to include charts or graphs, the decimal points will show up by default. This is hardcoded. We would like Oracle to develop functionality to allow editing this function for charts and graphs, in addition to tables.
Original Idea Number: b3a033ab21