Categories
- All Categories
- Oracle Analytics and AI Learning Hub
- 44 Oracle Analytics and AI Sharing Center
- 20 Oracle Analytics and AI Lounge
- 278 Oracle Analytics and AI News
- 56 Oracle Analytics and AI Videos
- 16.2K Oracle Analytics and AI Forums
- 6.4K Oracle Analytics and AI Labs
- Oracle Analytics and AI User Groups
- 103 Oracle Analytics and AI Trainings
- 20 Oracle Analytics and AI Challenge
- Find Partners
- For Partners
Welcome to the Oracle Analytics Community: Please complete your User Profile and upload your Profile Picture
Distinguishing and identifying data elements used in a visualization
PadminiKanive-Oracle
Rank 2 - Community Beginner
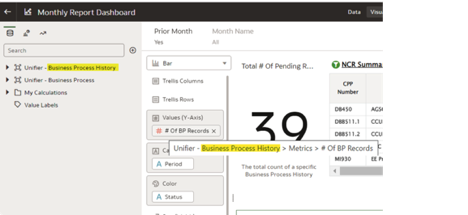
When working with multiple data sets (including subject areas), it would be great to identify via color coding or some mechanism which fields come from which data set for a given visualization. Right now, one needs to hover over the field to get a pop-up that shows the mapping/breadcrumb trail of where that field came from.
Tagged:
3
