Here is a canvas leveraging many technologies together within Oracle Analytics.
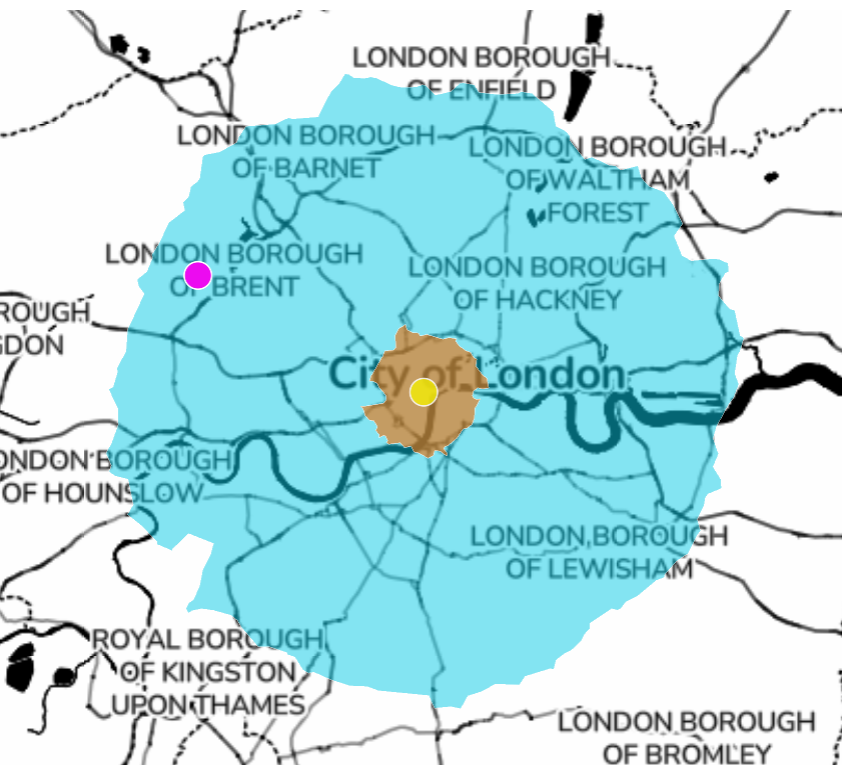
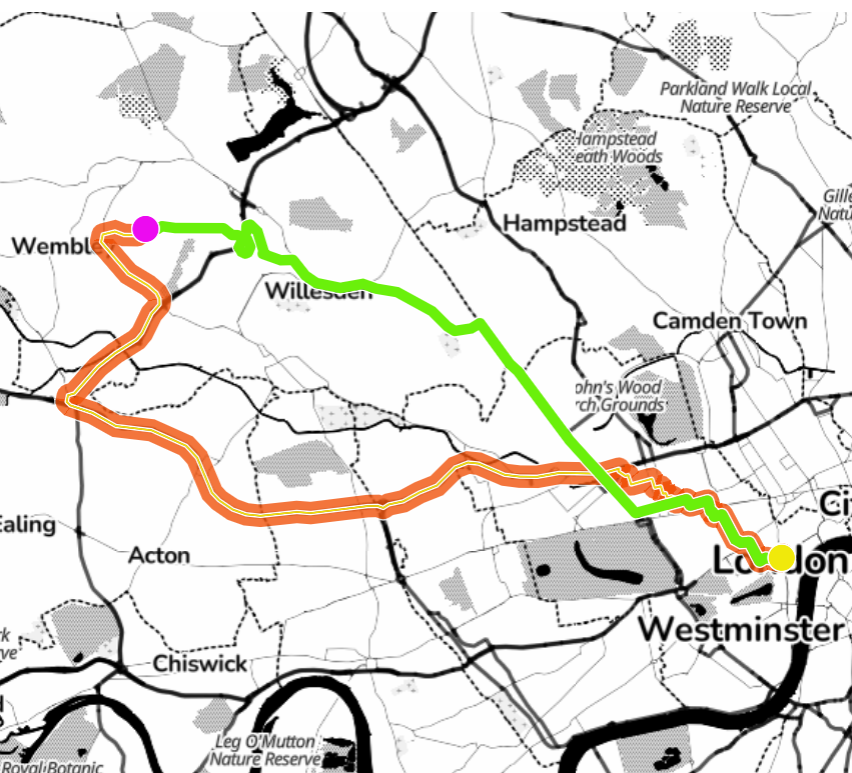
This OAC Public Live Canvas demonstrates how Oracle Analytics' geospatial capabilities can support urban planning by optimizing routes and accessibility analysis. Using Trafalgar Square as the starting point and Wembley Stadium as the destination, the canvas showcases how Spatial SQL from an Oracle Database can calculate:
- Shortest, fastest, and traffic-aware routes for better mobility planning
- Drive-time isopolygons, showing areas reachable within a set time or distance
- Geocoding and mapping insights to analyze urban accessibility
Refer to the documentation links for knowing more on the Spatial SQL Functions used in the canvas.
Mapiler Background 'MapTiler Toner' is configured as a custom Tiled Web Map within Oracle Analytics.
Regards,
Gautam.


