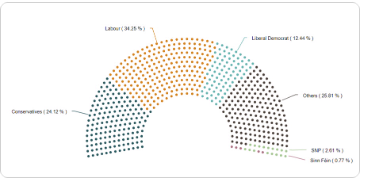
We’re excited to share the Parliament Chart custom extension in Oracle Analytics! This custom extension is an example that enables you to visualize election outcomes, legislative seat distributions, and other similar datasets in a powerful manner.
Why use the Parliament Chart custom extension?
- Clear and Engaging Visualization: Represents parliamentary seats in an intuitive, easy-to-understand format.
- Perfect for Election Analytics: Ideal for analyzing political party compositions and legislative structures.
- Beyond Elections: Can be adapted for other use cases, such as board compositions, stakeholder distributions, and segmented data representation.
Download this example custom extension and deploy it on your own Oracle Analytics instance
Read the full blog post to learn more:
https://blogs.oracle.com/analytics/post/visualize-election-outcomes-the-power-of-parliament-charts-in-oracle-analytics
Watch the walkthrough video: https://www.youtube.com/watch?v=FJhRzK3Z7D8
Thanks @Prasenjit_Thakur-Oracle for developing this example that showcases the power of Oracle Analytics SDK framework to build your own custom visualizations.


