Categories
- All Categories
- 15 Oracle Analytics Sharing Center
- 18 Oracle Analytics Lounge
- 218 Oracle Analytics News
- 44 Oracle Analytics Videos
- 15.8K Oracle Analytics Forums
- 6.1K Oracle Analytics Idea Labs
- Oracle Analytics User Groups
- 82 Oracle Analytics Trainings
- 15 Oracle Analytics Data Visualizations Challenge
- Find Partners
- For Partners
Welcome to the Oracle Analytics Community: Please complete your User Profile and upload your Profile Picture
What visualizations work best with Clusters?

User_F2RD3
Rank 4 - Community Specialist
I use NSAW and want to demonstrate a use case for adding Clusters to a visualization. Thanks for all suggestions!
Tagged:
1
Best Answer
-
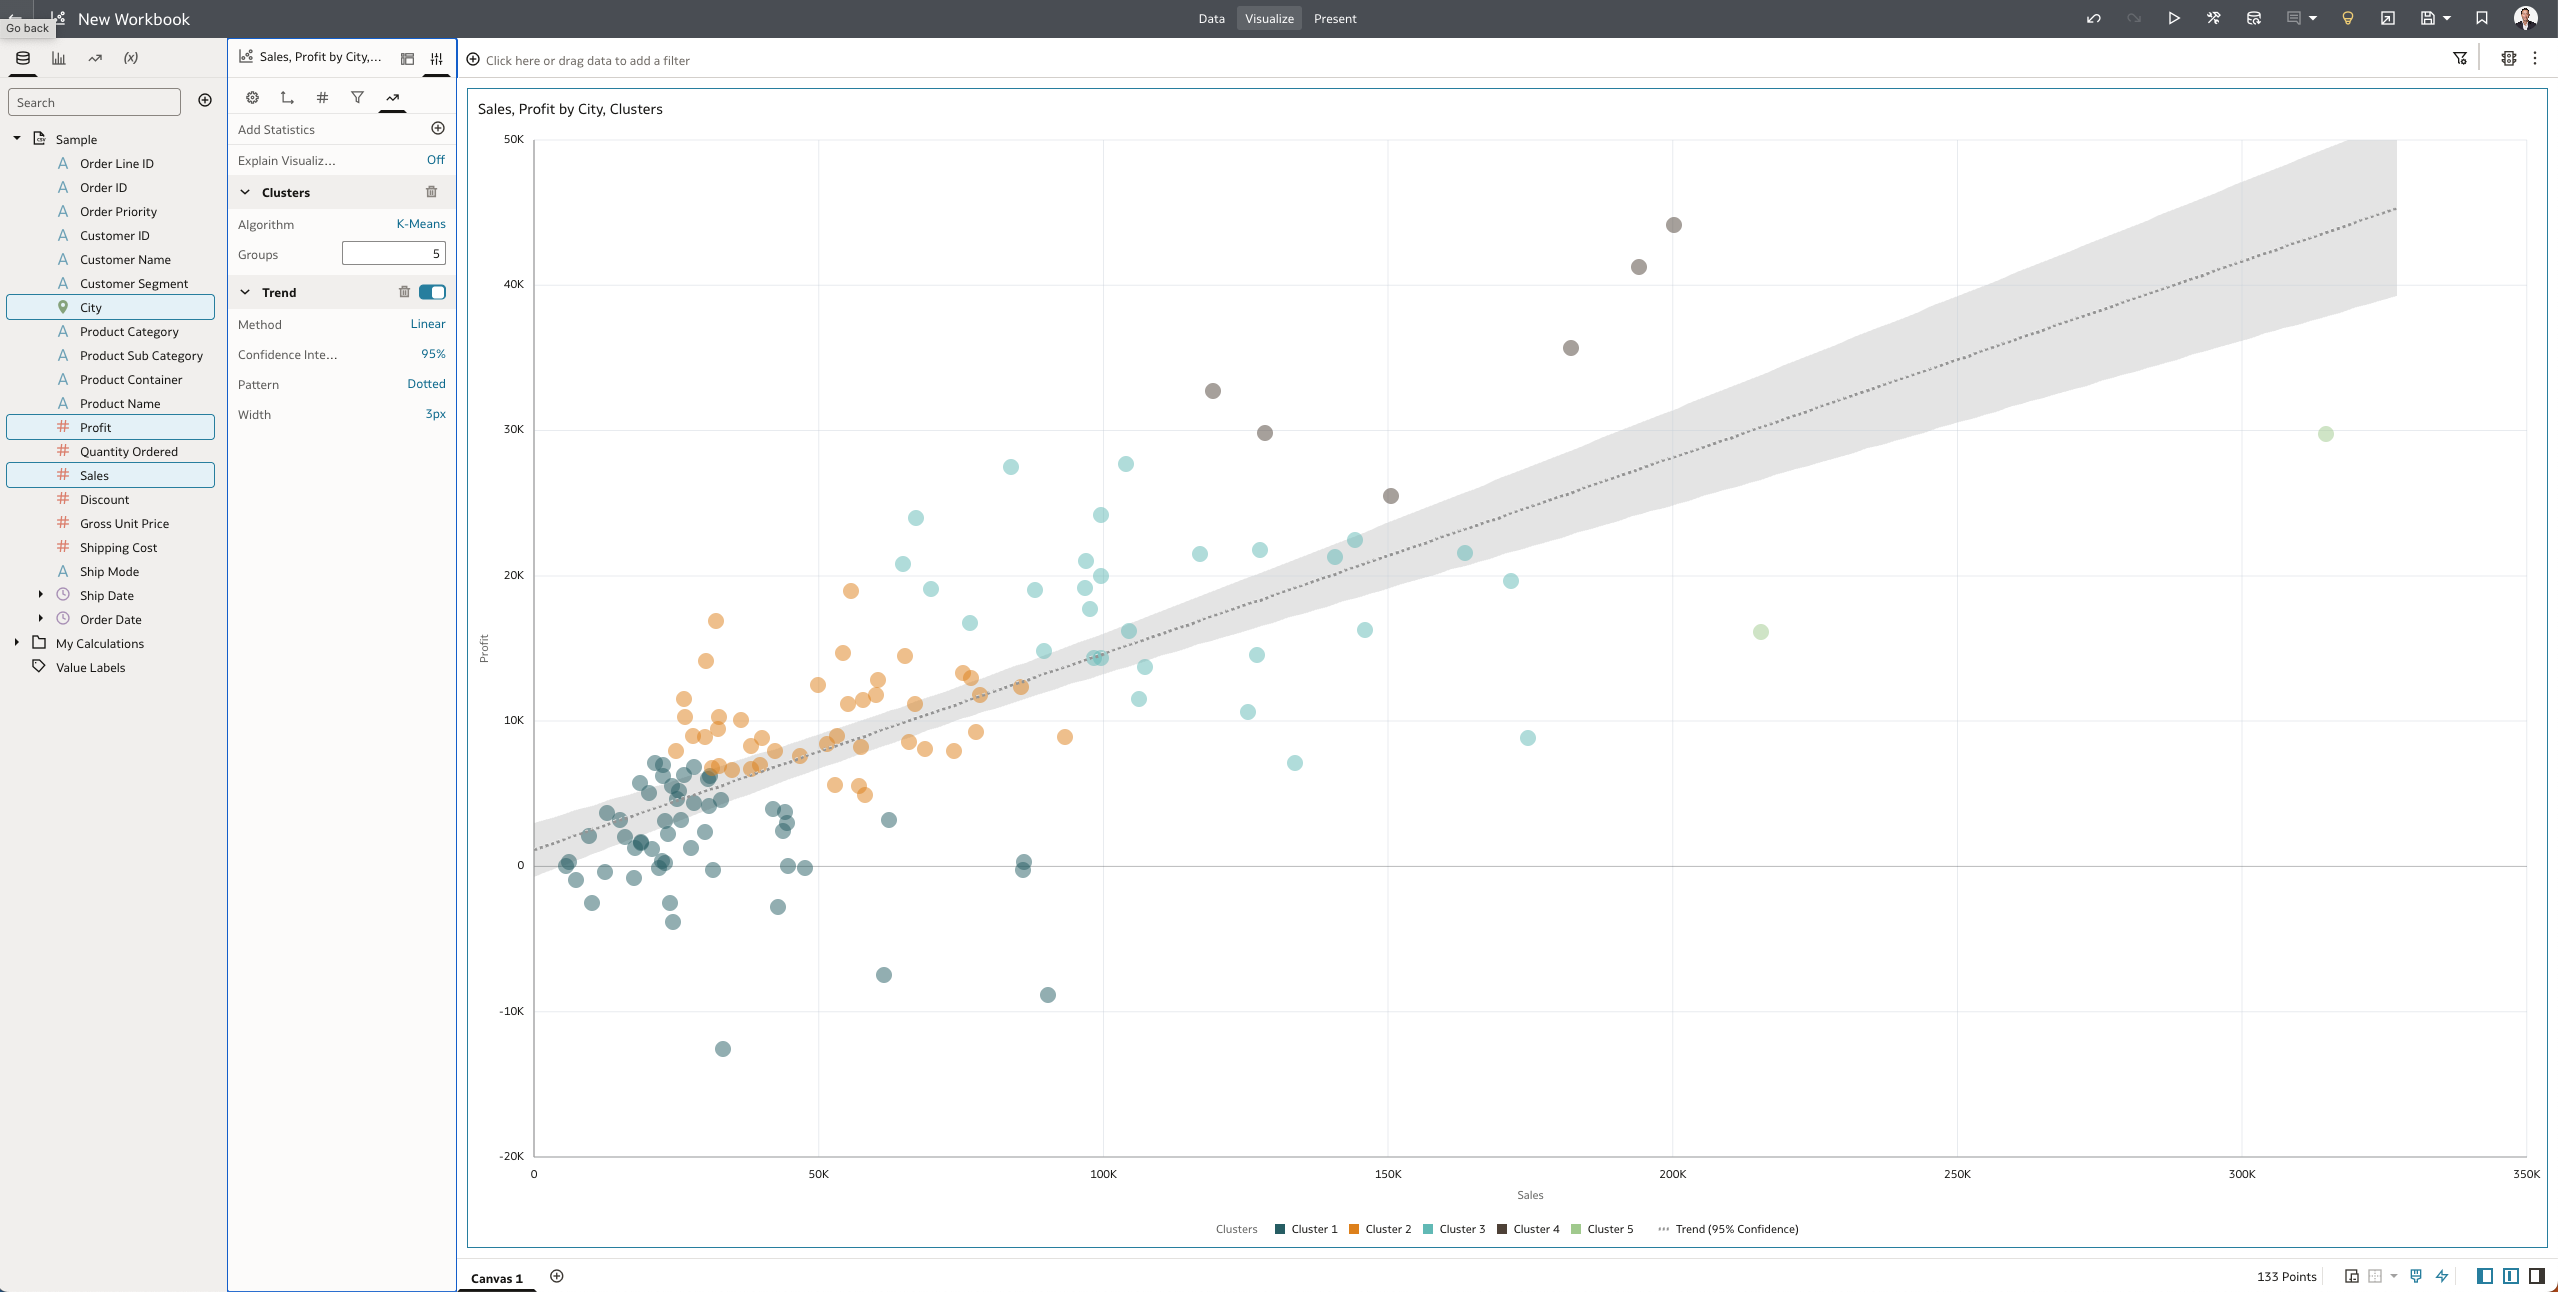
Hi, the ideal data visualization to use with Clustering is the scatter plot usually adding a linear trend line to see the points outside of the mean.
2
Answers
-
Very helpful.
Thanks for sharing @Benjamin Arnulf-Oracle!
1