Hi @Narendar Rao Naineni,
Please try the below:
2.Edit the Graph View: Click on the graph view (not the table or pivot view). Choose Edit View to open the graph configuration.
2. Access Graph Properties:
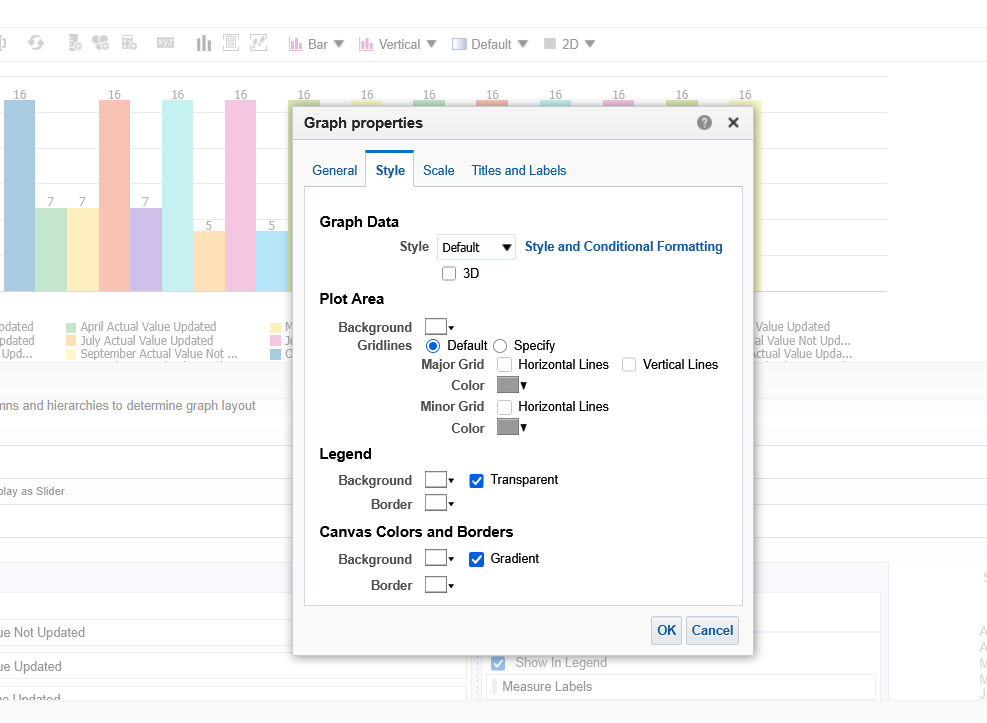
In the graph editor, look for the “Properties” or “Style” tab.
3. Adjust Bar Spacing:
Look for a setting called “Bar Gap”, “Bar Width”, or “Cluster Width”. These options control the spacing between bars in clustered bar charts. Reduce the cluster width or increase the bar gap to create more space between bars.
4. Preview and Save:
Preview the changes to ensure the spacing looks right. Save the report.
Thanks, Riyaz Ali
Hi @Riyaz Ali-Oracle
We are not able to find the setting called "Bar width" , "Bar gap" or "Cluster width".
Please check below:
Create a Chart from an OTBI Analysis
Graph Data in Analyses