1. Which dataset did you use?
BMW Global Sales Dataset (2010-2024) available at Kaggle. https://www.kaggle.com/datasets/ayeshaseherr/bmw-dataset
2. How did you analyze or prepare the data?
I used Auto-Insights features available in OAC.
3. Who is the intended audience for your visualization?
Automobile Sales manager.
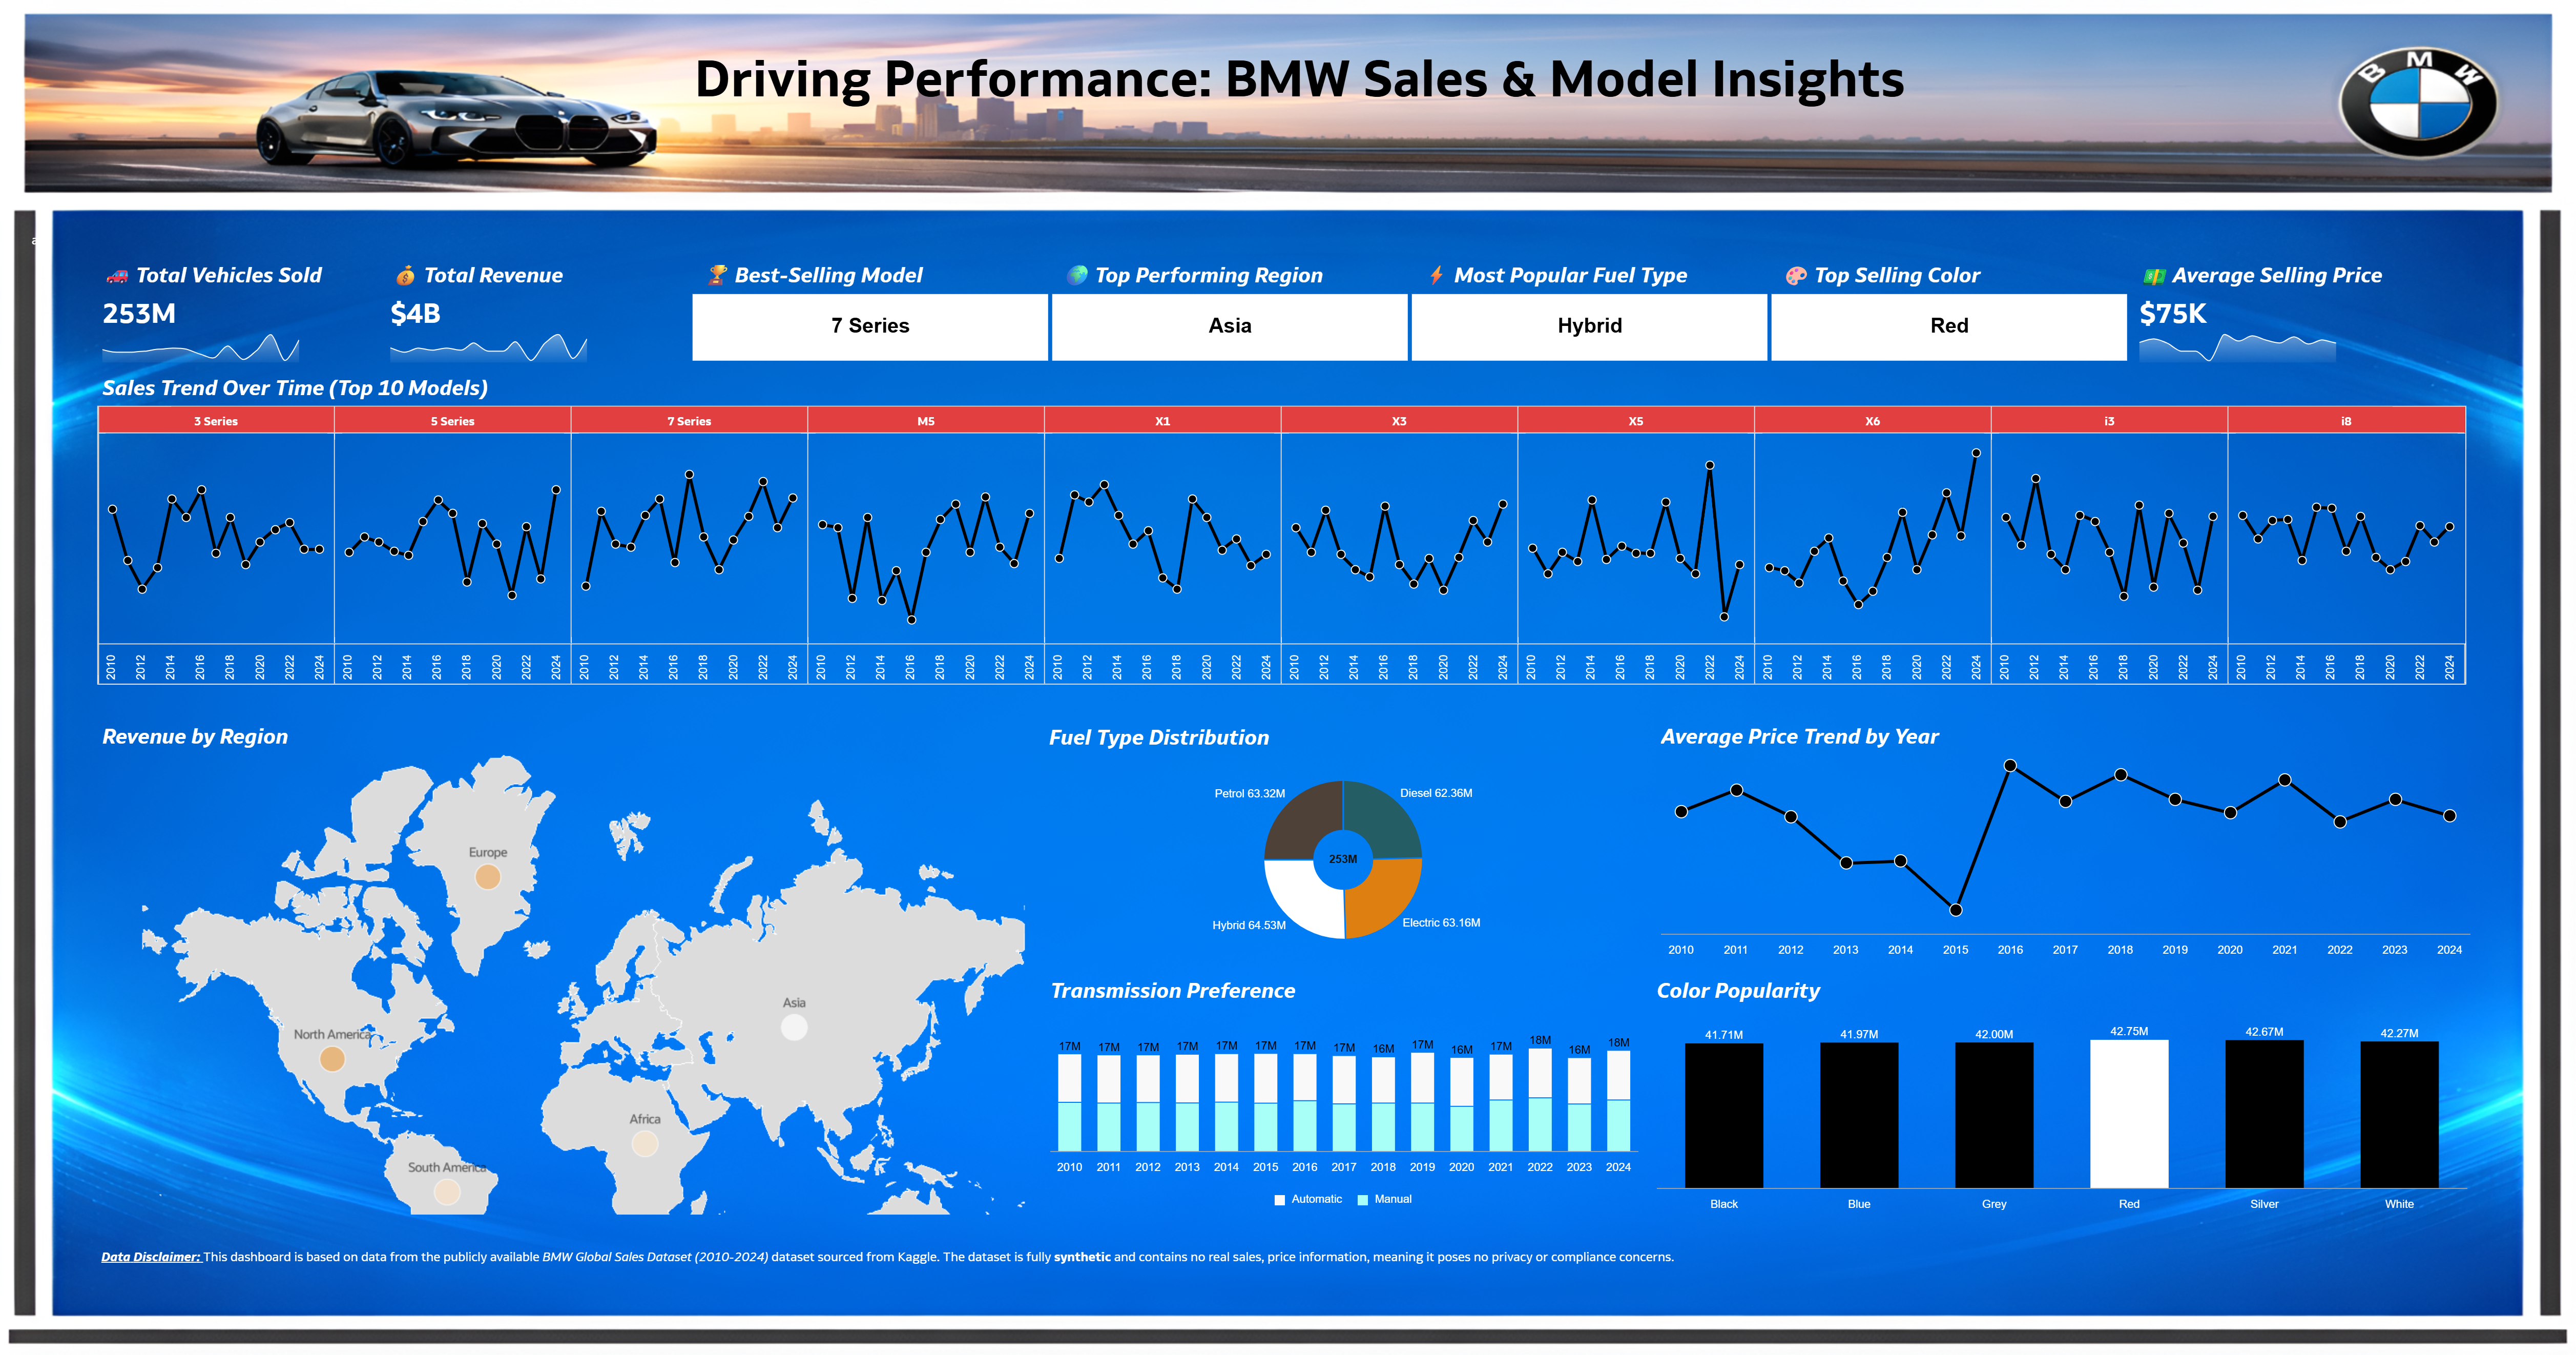
4. What is your visualization about, and what question or problem does it address?
This visualization provides a comprehensive overview of BMW’s sales performance, customer preferences, and model trends across different regions and years. Manager can analyze overall sales volume and revenue, identify top-performing models and regions, and track year-over-year growth. The visualization also highlights evolving customer preferences such as fuel type adoption, transmission trends, popular vehicle colors. Regional comparisons and model-level analysis make it easy to identify market strengths, emerging trends, and opportunities for growth. Regional comparisons and model-level analysis make it easy to identify market strengths, emerging trends, and opportunities for growth.
5. Did you use any Oracle Analytics AI features when building your visualization (ex. AI Assistant)? If so, please describe how they were used
Yes, I asked few questions to the AI Assistant, example giving me the top 10 Models by sales and I used the same for one of the visual.
6. Did you upload your visualization image and dva file?
Completed!