Introduction
OAC AI Agents generate insights directly from your semantic model and underlying datasets. Insights must align with approved fiscal calendars, KPI definitions, grouping standards, and reporting conventions that reflect how the business operates. This section presents templates that can serve as reference models for your use case.
These Supplemental Instruction Templates provide structured examples that guide AI Agents to interpret, calculate, filter, and present data according to your organization’s defined business logic. Rather than relying on default interpretation, these templates demonstrate how you can standardize Agents' behavior according to your use cases.
Note: These templates are provided as reference examples only. They are intended to demonstrate common instruction patterns and may require modification to align with your policies, and reporting standards. Oracle recommends reviewing and validating all instructions in a controlled environment before deploying them to production.
List of Use Cases
- Grouping of Attributes
- Hierarchies and Drill-Downs
- Setting a Default Metric
- Defining Default Chart Types
- Default Reports / Shortcuts
- Formulas and Calculations
- Top N and Bottom N Logic
- Handling Fiscal Calendars
- Setting Aggregation Rules
- Distance Calculations Using Latitude and Longitude
- Distance Calculations while using Information from Knowledge Documents
- Calculating KPIs Using Knowledge Documents
- Adding Dictionaries or Value Mappings Using Knowledge Documents
- Maintaining Persistent Filters Across Conversations
- Standarding Average Calculations
Grouping of Attributes
One of the most common challenges in enterprise analytics is that raw data classifications do not always match how the business defines its categories. Different systems, departments, or regions may use varying names, codes, or groupings for the same attributes—creating confusion and inconsistency in analysis. This example helps you define your own logical groupings or categories or adding names according to your requirements.
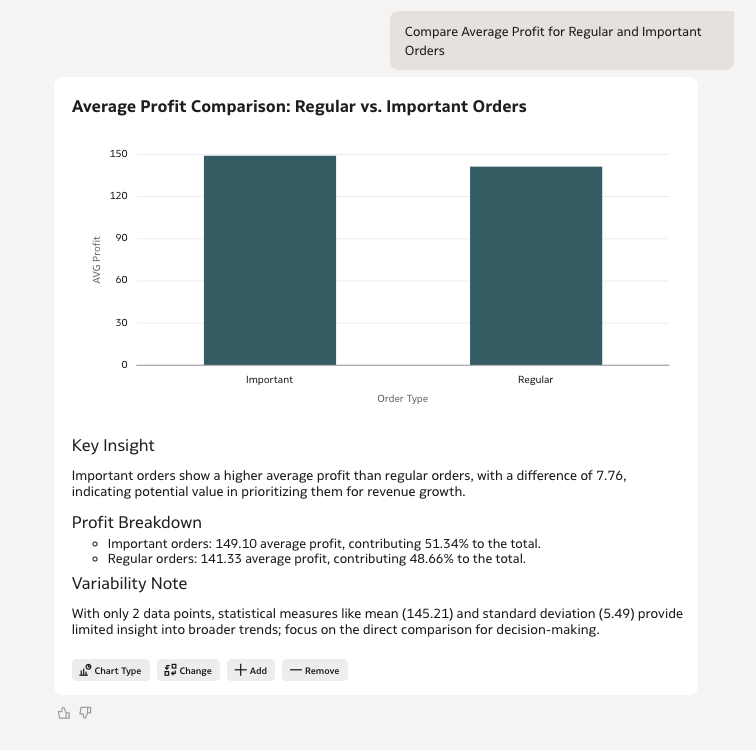
In this example, we want to consolidate the "Order Priority" column into two business-friendly groups. The original dataset contains the following values: Low, Medium, High, Critical, Not Specified From a business reporting perspective, however, users prefers to analyze orders under two broader categories:
- Regular → Low, Medium, Not Specified
- Important → High, Critical
Instructions:
When user asks about Important Orders or Regular Orders, use the following exact mapping:

-  "Low, Medium, Not Specified" are mapped to "Regular" Orders and

- "High, Critical" are mapped to "Important"

When user uses key words such as,  "important",  "regular", "important vs regular" , use the above mapping of the "Order Priority."
Sample Utterance and Result:
"Compare Average Profit for Regular and Important Orders"
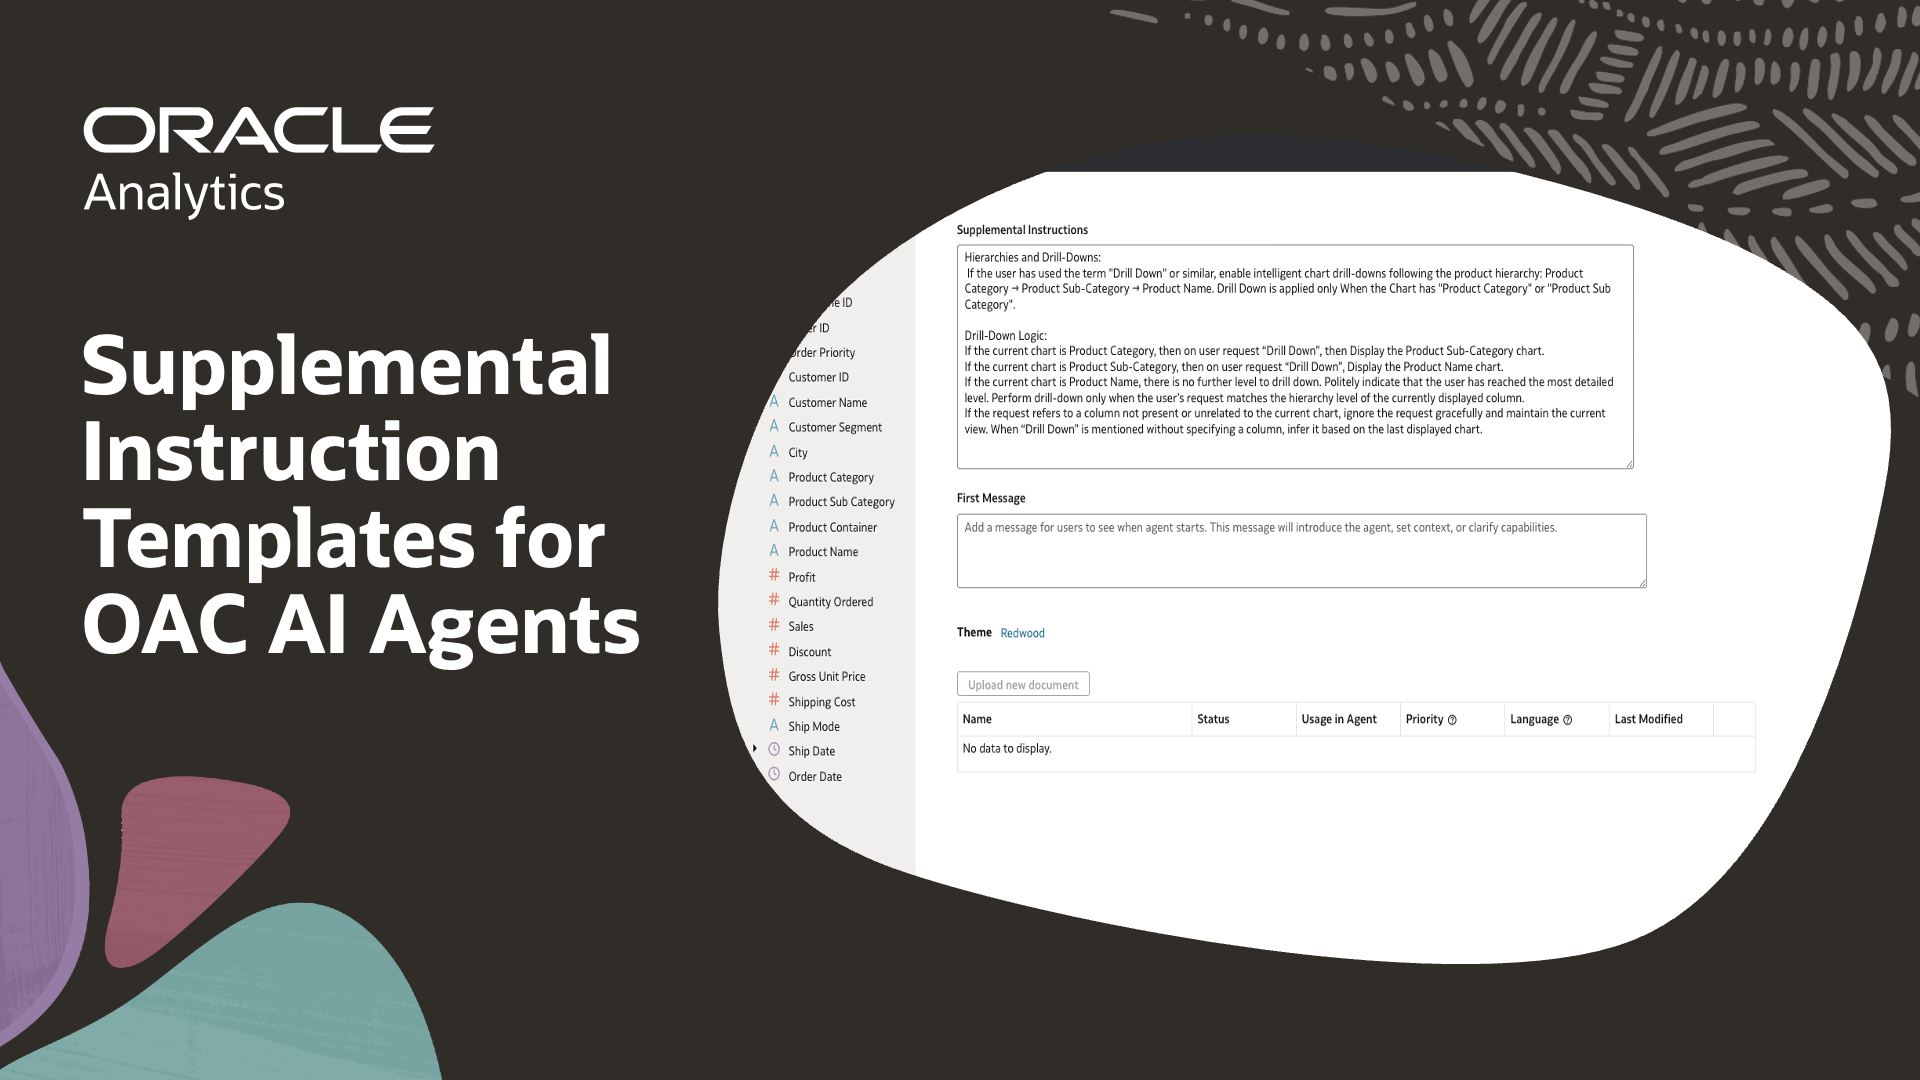
Hierarchies and Drill-Downs
In business reporting, decision-makers rarely stop at a single aggregated view. You want to review the metrics at a high level first and then want to progressively explore deeper layers of detail. This structured exploration is commonly referred to as a drill-down hierarchy.Without guidance, an AI system may treat all fields as flat attributes rather than understanding the intended analytical hierarchy. You can define custom Instructions that allows you to explicitly define these hierarchical relationships.
Instructions:
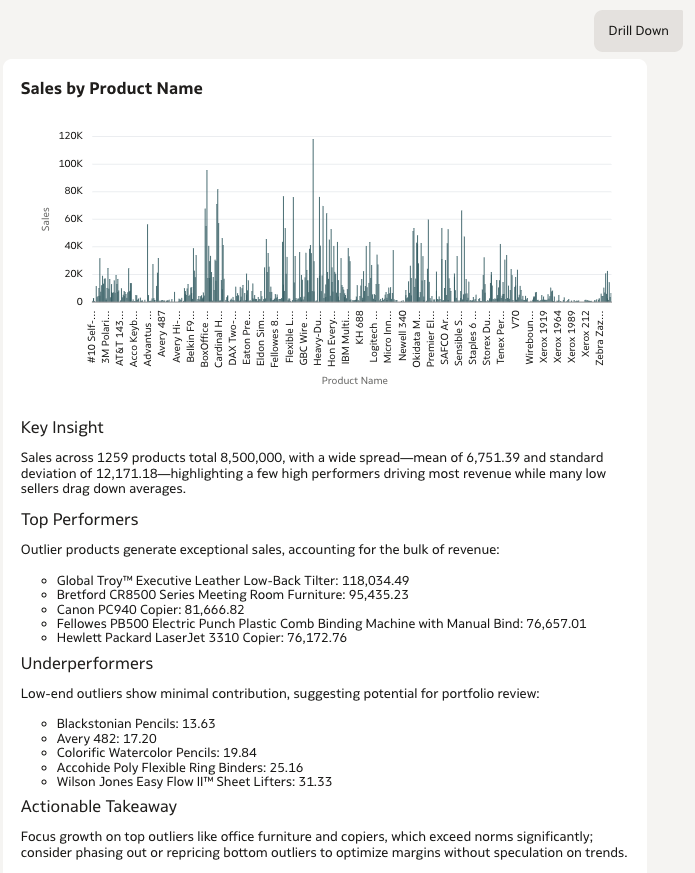
If the user has used the term "Drill Down" or similar, enable intelligent chart drill-downs following the product hierarchy:
Product Category → Product Sub-Category → Product Name.
Drill Down is applied only When the Chart has "Product Category" or "Product Sub Category".
Drill-Down Logic:
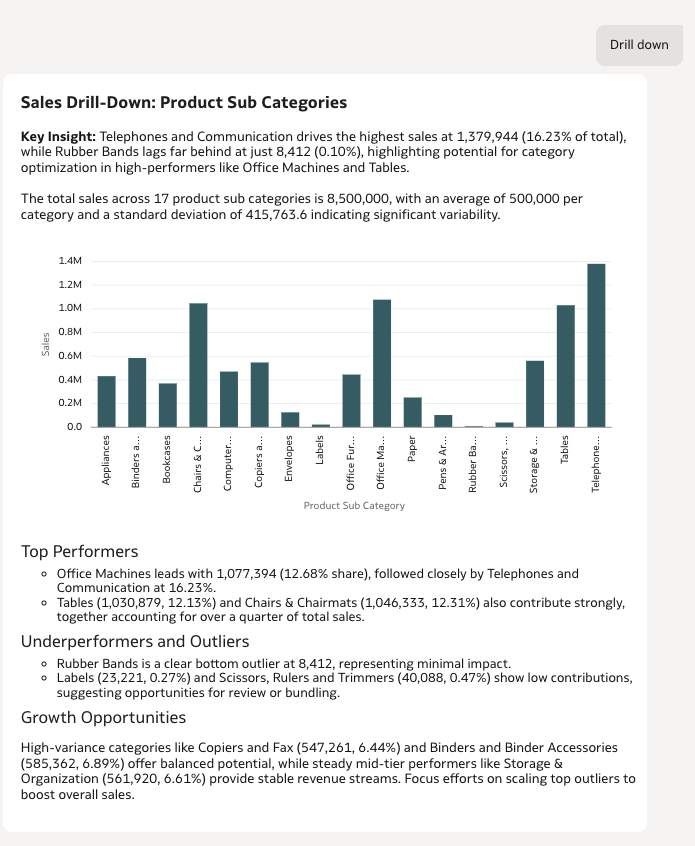
If the current chart is Product Category, then on user request "Drill Down", then Display the Product Sub-Category chart.
If the current chart is Product Sub-Category, then on user request "Drill Down", Display the Product Name chart.
If the current chart is Product Name, there is no further level to drill down. Politely indicate that the user has reached the most detailed level. Perform drill-down only when the user’s request matches the hierarchy level of the currently displayed column.
If the request refers to a column not present or unrelated to the current chart, ignore the request gracefully and maintain the current view. When “Drill Down” is mentioned without specifying a column, infer it based on the last displayed chart.
Sample Utterances and Results:
Ask an uttrence with Product Category and the followed up by Drill Down.
"Profit by Product Category" → | "Drill Down" → | "Drill Down" |
|---|
|
|
|
Setting a Default Metric
As an Agent Creator, you can specify how results should behave or be presented when users ask broad or high-level questions. This ensures that insights remain consistent, intuitive, and aligned with business expectations — even when the user query lacks specificity. In many datasets, users frequently ask open-ended questions such as: "Show performance by region", "Compare across products", "How are we doing this quarter?". While these questions are clear in intent, they often do not specify which metric should be used — Revenue? Profit? Order Volume? Margin? Without guidance, the AI may either choose a metric that may not align with business priorities or may not answer the question.
You can use customized instructions by setting a default metric ensures consistent interpretation of high-level or ambiguous queries.
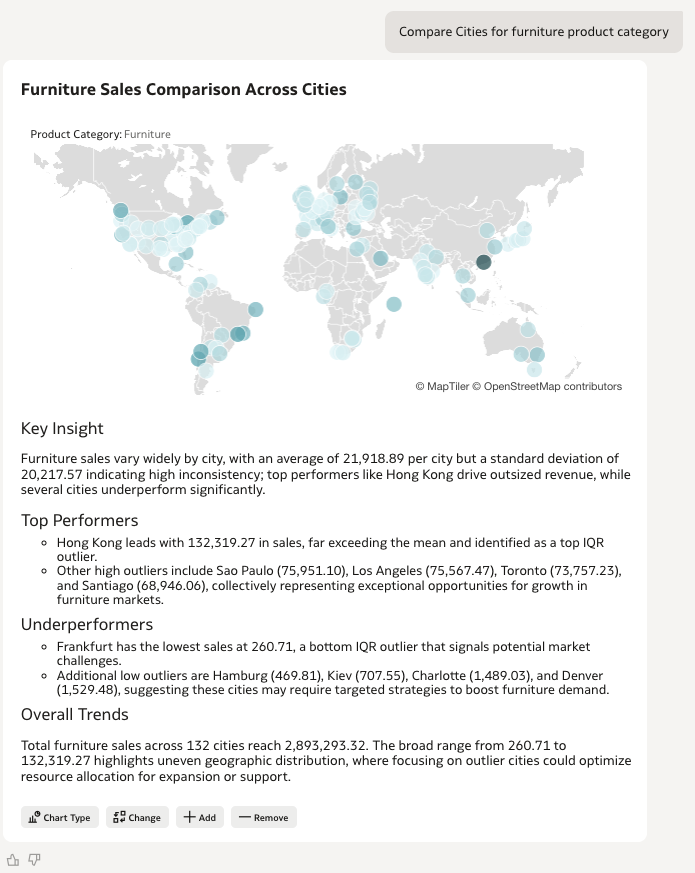
If the user does not specify any metric, and ask generic questions use "Revenue" as the default metric for all aggregations and charts.
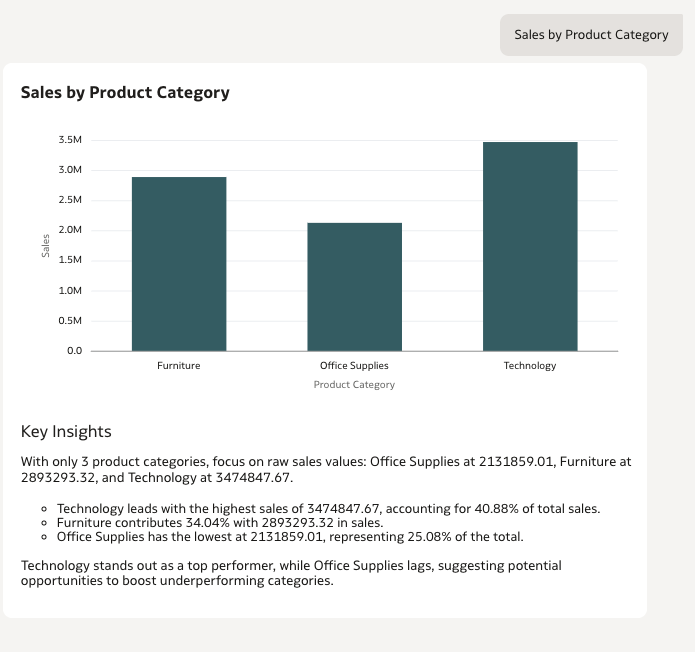
For example if user asks "compare performance across Product Categories" provide visual related to Product Category by Sales.
Sample Utterance and Result:
"Compare Cities for furniture product category"
Defining Default Chart Types
You can also guide how insights are visually presented. Custom Instruction Templates allow Agent Creators to define default visualization types. This ensures that outputs are not only accurate — but also presented in a way that aligns with your reporting standards.
Instructions:
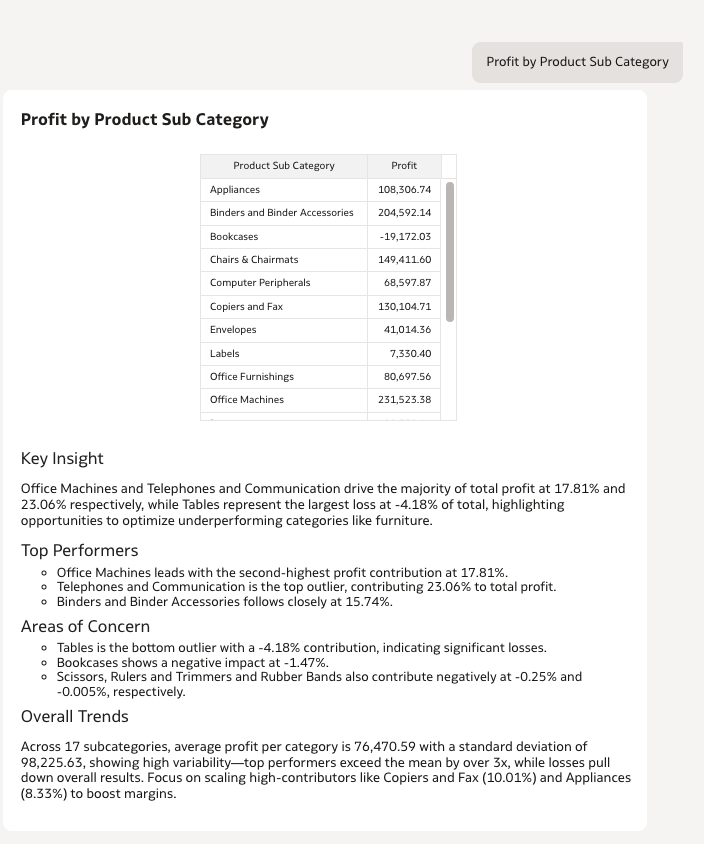
If the query involves comparison (e.g., "compare", "vs", "across") for Product Category, Product Sub-Category, or any categorical comparison → Always use Table.
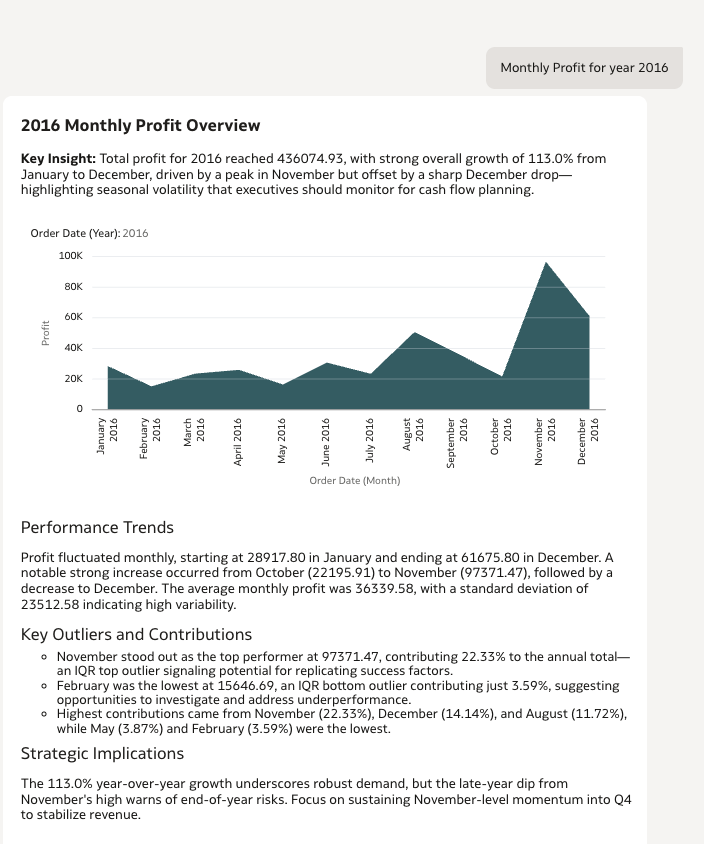
If the query involves any time-based field (Date, Month, Quarter, Year) → Always use Area Chart.
Apply these defaults even if the user does not specify a chart.
Only override if the user explicitly requests a different visualization.
Sample Utterances and Results:
"Profit by Product Sub categories" | "Monthly Profit for Year 2016" |
|---|
|
|
Default Reports / Shortcuts
Objective:
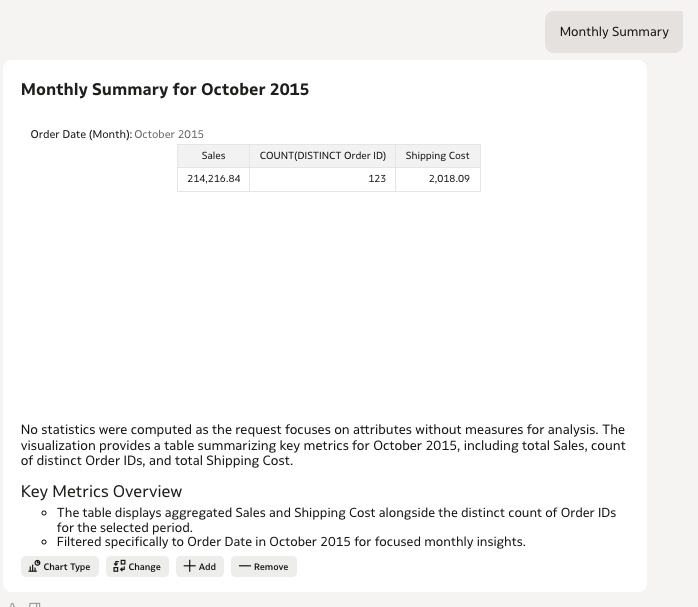
Enable predefined shortcuts for recurring business queries such as "Monthly Summary" or "Monthly Report". Using Custom Instructions, you can map specific keywords to a predefined report structure. When users enter a shortcut phrase, the Agent automatically generates a standardized output — including defined metrics, filters, groupings, and chart types. This ensures consistency, saves time, and aligns recurring analysis with common reports.
Instructions:
When user asks "Monthly Summary", "Monthly Report", "Summary", "Report" or "Performance this month",
automatically apply filter where Order Date (Month) = October 2025,
then Generate a Table with the following Metrics.
- Revenue (Sum)
- Orders (Count of Distinct Order ID)
- Shipping Cost (Sum)
Note: Month is Hard Coded in this case
Sample Utterance and Result:
When user asks "Monthly Summary", you get a Table.
Formulas and Calculations
You can define domain-specific or company-specific KPI calculations using Supplemental Instructions. In many cases, key performance indicators (KPIs) are not directly stored in the dataset. Instead, they are derived using business-defined formulas that may vary by company, industry, or reporting standard. Without explicit guidance, an AI system may compute metrics using generic definitions. Using Supplemental Instructions, Agent Creators can formally define: Custom KPI formulas, Company-specific calculation logic, Adjustments or correction factors, Derived metrics not physically stored in the dataset.
Instructions:
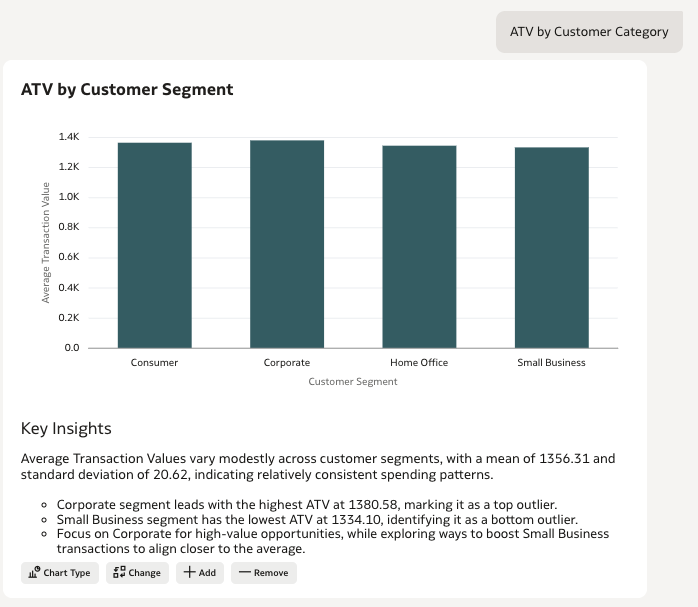
KPI : Average Transaction Value (ATV):
When users asks about ATV (Average Transaction Value),
use the following formula to compute : Sum(Sales_Revenue) / Count Distinct (Order ID), and
use the same formula to aggregate at a group level.
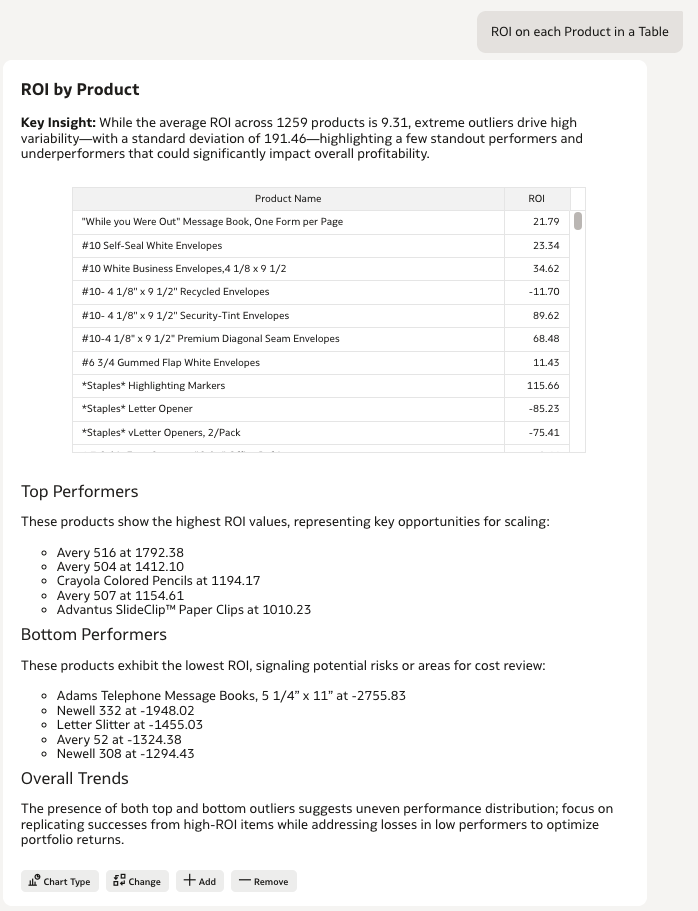
KPI : Return on Investment ROI:
When users asks about ROI (or any such variants),
use the following formula to compute : 100*(Sum(Profit) /((Sum(Discount)*Sum(Shipping Cost))), and
use the same formula to aggregate at a group level.
Sample Utterances:
"ATV Per Customer Category" | "ROI on each Product in a Table" |
|---|
|
|
Top N and Bottom N Logic
Objective:
You can define consistent and predictable behavior for all "Top N" and "Bottom N" queries. In business conversations, users frequently ask for:
"Best products", "Highest performing Cities", "Least profitable Product Sub categories", "Lowest sales cities". Without defined rules, ranking logic may vary — leading to inconsistent outputs across users.
Instruction Example:
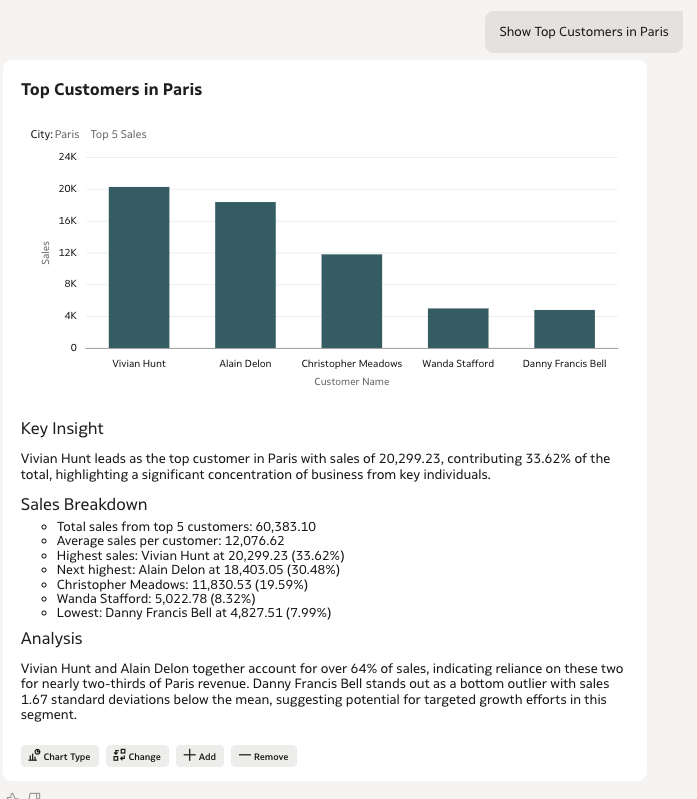
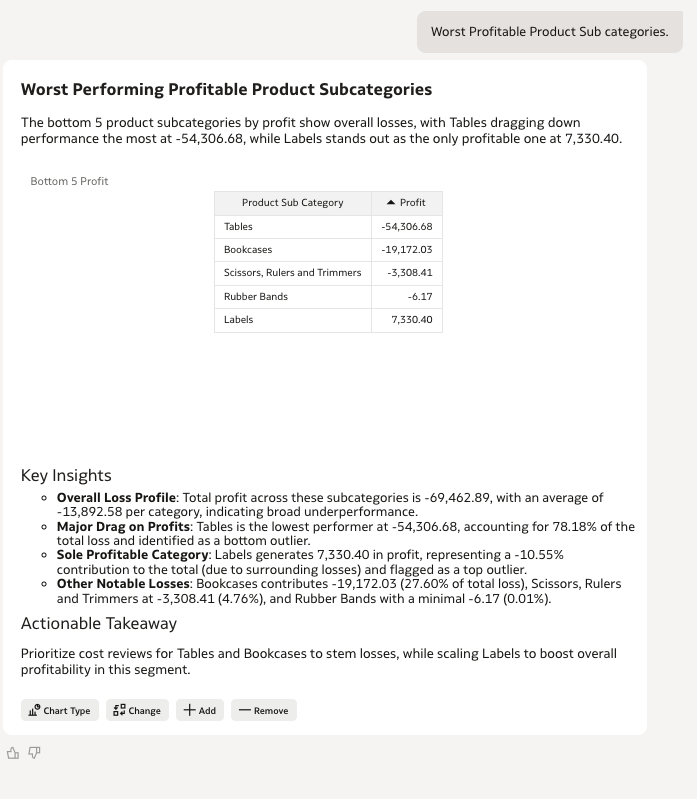
When the user asks for "Best", "Highest", "Most profitable", "Most Sales", "Leading" or "Top items", rank by Top 5 records in descending order by default.
When the user asks for "Bottom", "Least", "Lowest", or "Slowest", rank by Revenue ascending and return the Bottom 5 records by default.
If the user does not specify metric use "Sales" by default. If user specifies, use the metric specified by user.
If User specifies number of categories to be apply Top N accordingly.
For example:
 - "Best 5 Products by Profit" → Top 5
 - "Bottom 3 Cities by Sales" → Bottom 3 Cities.
 - "Cities with highest discount" → Top 5 Cities
Sample Utterances and Results
“Show Top Customers in Paris” | “Worst Profitable Product Sub categories” |
|---|
|
|
Handling Fiscal Calendars
Most organizations do not operate strictly on the standard Gregorian calendar (January–December). Fiscal years often begin in different months, and business quarters are defined according to internal financial reporting structures. If not explicitly defined, an AI system may default to calendar-year logic — leading to incorrect interpretations of terms such as: "Current Quarter", "This Fiscal Year" and so on. To prevent misalignment, Custom Instructions allow you to formally define your fiscal calendar structure.
The following enable full support for custom fiscal calendars (e.g., Fiscal Q1 = May–July) and explicitly prevent the use of Gregorian calendar definitions where business logic requires otherwise.
Instruction Example:
Use the Fiscal Calendar (FY = Jun 1–May 31).
Quarters: Q1 Jun–Aug, Q2 Sep–Nov, Q3 Dec–Feb, Q4 Mar–May.

Columns (exact, with spaces): "Fiscal Year", "Fiscal Quarter". Always quote identifiers.
Year values: "FY 2026" (space after FY)
Quarter values: "FY2026 Q2" (no space after FY, one space before Qn)
Never auto-add/remove spaces—match dataset exactly. Trim and case-fold user text, but filters must use canonical spacing. Quote string values.

Mappings → Filters:
- "current/this quarter", "current fiscal quarter" → "Fiscal Quarter" = "FY2026 Q2"
- "current/this year", "current fiscal year" → "Fiscal Year" = "FY 2026"
- "previous/last/prior quarter" → "Fiscal Quarter" = "FY2026 Q1"
- "previous/last/prior year" → "Fiscal Year" = "FY 2025"
- "next/upcoming/following quarter" → "Fiscal Quarter" = "FY2026 Q3"
- "next/upcoming/following year" → "Fiscal Year" = "FY 2027"

Specific month/date (e.g., "Feb 2023") → map to its fiscal quarter (Dec–Feb → FY2024 Q3) and filter "Fiscal Quarter" accordingly.
Rule for Quarter should be based on Quarters: Q1 Jun–Aug, Q2 Sep–Nov, Q3 Dec–Feb, Q4 Mar–May.
Sample Utterance and Result:
User asks: "Show Revenue for Current Quarter" → Agent applies Fiscal Quarter = FY26 Q2.
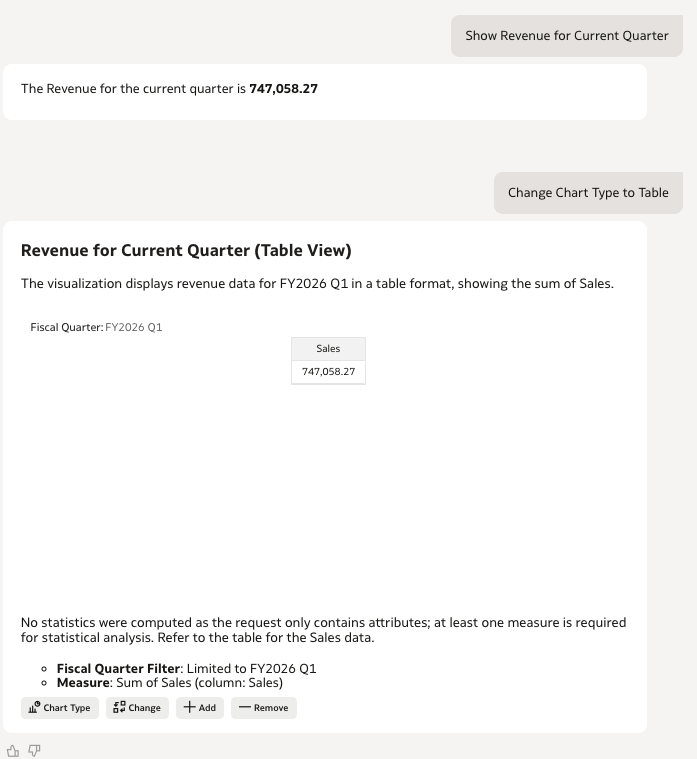
Note: Fiscal Dates are hard coded
Setting Aggregation Rules
Ensure that each metric follows a consistent, business-approved aggregation method — even when the user does not explicitly specify it.
In most datasets, different measures require different aggregation logic to produce meaningful insights. For example: Revenue should be Summed, Quantity should be Counted or Summed (based on business definition), Shipping Rate should be Averaged, etc. Without predefined rules, AI Agents may apply incorrect aggregations — such as averaging revenue instead of summing it — leading to misleading or materially incorrect conclusions. This Custom Instruction helps consistency at the Agent level.
Instructions:
When aggregating metrics, apply the following default rules unless the user specifies otherwise:
- Revenue, Sales = Sum(Sales)
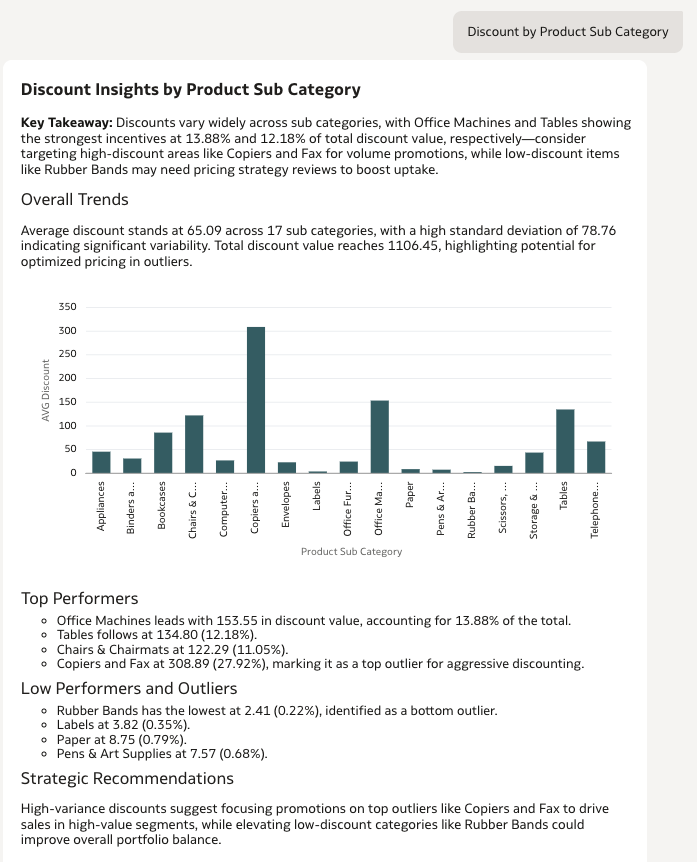
- Discount = Average (Discount)
If the dataset contains other numeric fields without explicit instruction, apply Sum as the fallback aggregation method.
When the user includes a keyword like "average", "count", or "sum", override the default aggregation accordingly.
Sample Utterance:
"Discount by Product Sub Category"
Distance Calculations Latitude and Longitude
Objective:
In many business datasets, latitude and longitude are available for customers, stores, or other locations. Rather than relying only on a location name or label, you can use these coordinates to calculate distance and support location-based analysis.
This approach enables common business use cases such as:
- Filtering records within a defined radius (e.g., “within 250 miles of Nashville”)
- Automatically Aggregating metrics around a Geo-Location
- Comparing performance across geographies using distance as a consistent measure (e.g., “near Atlanta”)
Note: Lat/Long columns should be set up as Location Type fields in the dataset.
Instructions:
Geospatial or Map Questions:
When asked for a map or geographic questions, use LATITUDE and LONGITUDE columns as the only authoritative coordinates for each record and plot the data
Interpret coordinates as decimal degrees : Latitude range: -90 to 90 and Longitude range: -180 to 180 (both positive and negative values)
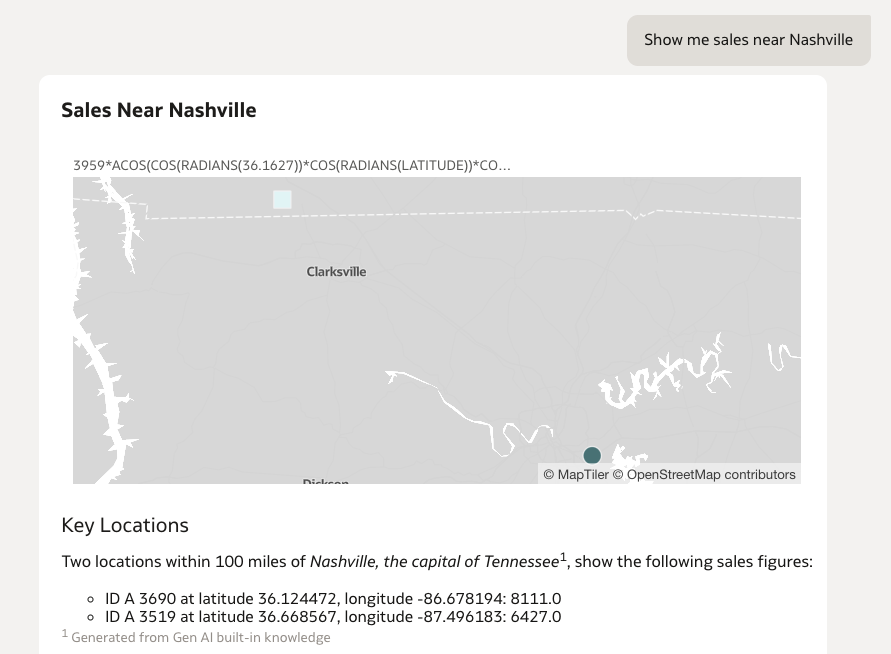
When the user asks questions: “within X miles of …”, “within X mi of …” or “within X miles of <location>”, interpret this as a distance filter: Compute distance from each record’s (LATITUDE, LONGITUDE) to the specified location. Keep only records where Distance <= X miles. If the user does not specify X miles are not specified and terms like near or at the localtion used, the default is 100 Miles. Default Chart type for all such questions is 'Map'.
Examples:
“Map customers near New York.” -> Resolve to New York Coordinates, apply default 100 miles, output Map.
“Find orders within 15 mi of (40.7128, -74.0060).” -> compute the filter <= 15 miles, output Map.
Sample Utterances
When the user asks, "Show me sales near Nashville"
Distance Calculations while using Information from Knowledge Documents
In many business datasets, latitude and longitude are already available. In addition, your RAG/knowledge documents may contain shop location details (for example, latitude/longitude coordinates of the shop). To answer questions such as “show sales near this shop-abc” or “find unique number of customers within X miles of a shop,” you can use the coordinates from the knowledge document as the reference point and calculate distances to filter or group your dataset accordingly.
Note: Lat/Long columns should be set up as Location Type fields.
Instructions:
When asked for a map or geographic questions, use LATITUDE and LONGITUDE columns as the only authoritative coordinates for each record and plot the data
Interpret coordinates as decimal degrees : Latitude range: -90 to 90 and Longitude range: -180 to 180 (both positive and negative values)

When the user asks questions:
“within X miles of …”, “within X mi of …” or “within X miles of <location>”, interpret this as a distance filter: Compute distance from each record’s (LATITUDE, LONGITUDE) to the specified location. Keep only records where Distance <= X miles. If the user does not specify X miles are not specified and terms like near or at the localtion used, the default is 100 Miles.  Default Chart type for all such questions is 'Map'.

Examples:
Example A — Shop alias

User: “Show locations within 20 miles of ABC shop.”
Shop Cordinates are picked up from Knowledge Document (RAG)
System: Resolve “ABC shop” → Shop-ABC (41.8781, -87.6298), filter <= 20 miles, output Map.
Example B — Default radius

User: “Map customers near New York.”
System: Resolve to New York Coordinates, apply default 100 miles, output Map.
Example C — Explicit coordinates

User: “Find orders within 15 mi of (40.7128, -74.0060).”
System: Validate ranges, compute Haversine, filter <= 15 miles, output Map.
Treat the above locations as the source of truth for named business locations such as “Shop-ABC”, “Shop-ATT (ATL)”, etc.
When a user refers to a shop or shorthand, “Shop ABC”, “ABC shop”, “store ABC” → map to the coordinates given above. Answer the questions using the Coordinated Mentioned.
Knowledge Document (RAG)
Text from the knowledge document:
Named shop locations :
Treat the following shop coordinates as the source of truth whenever a user references a shop name, alias, shorthand, or store wording.
Canonical shop coordinates (decimal degrees):
Shop-ABC: (41.8781, -87.6298)
Shop-MNO: (44.9778, -93.2650)
Shop-PQR: (39.9526, -75.1652)
Shop-HIJ: (33.4484, -112.0740)
Shop-ATT: (33.7490, -84.3880)
Shop-XYZ: (40.7128, -74.0060)
Sample Utterances
When the user asks, "Show me sales near Shop-HIJ"
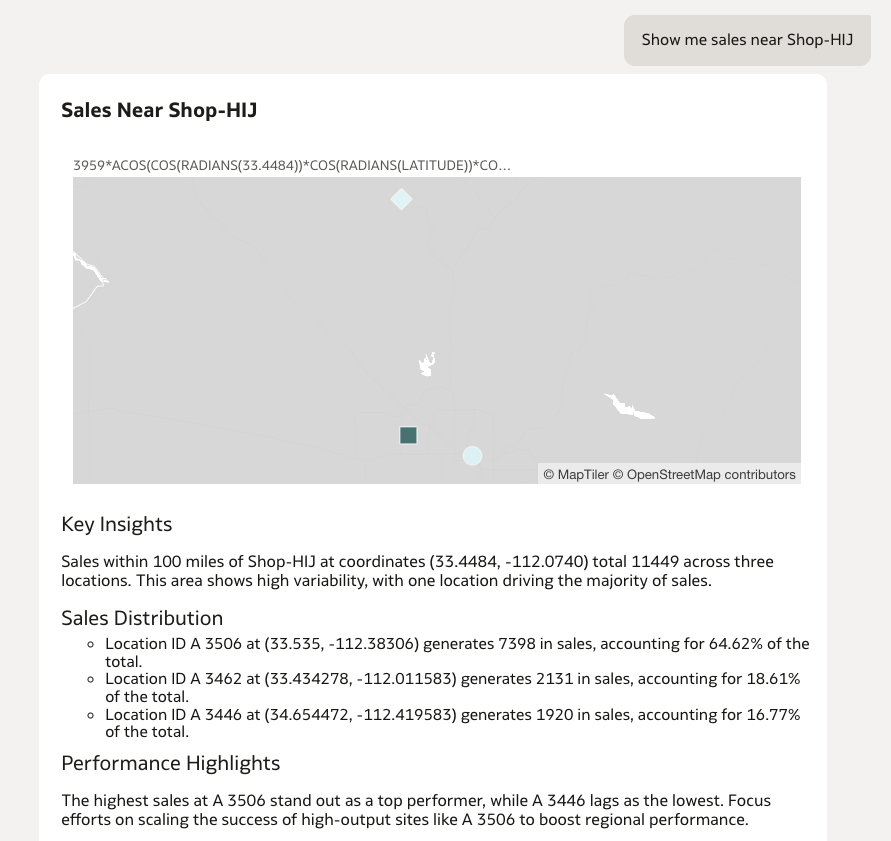
Calculating KPIs Using Knowledge Documents
Businesses rely on Key Performance Indicators (KPIs) to measure performance and track progress toward strategic objectives. These KPIs often require specific calculation rules defined by the organization. In many cases, the official KPI definitions and formulas are documented in policy documents, operational manuals, or internal company guidelines. Oracle Analytics Cloud (OAC) allows these documents to be uploaded as Knowledge Documents within an AI Agent. When users ask questions that involve KPI calculations, the agent retrieves the relevant definitions from these documents and applies the specified formulas when generating results.
Using this approach ensures that analytics outputs follow the organization’s official KPI definitions, rather than relying on assumptions or generic calculations. The resulting charts and visualizations are generated according to both the user’s request and the calculation rules defined in the uploaded knowledge documents.
Note:
Ensure that KPI definitions in knowledge documents are written in clear, precise, and mathematical terms to avoid ambiguity and ensure consistent calculations.
Instructions:
When user asks for a Particular KPI, use the information from available from RAG to calculate the KPI.

KPI Examples:
Example A:
User: “Show NPM for all Product Sub Categories.”
Use NPM (Net Profit Margin %) calculation from Knowledge Document (RAG) is used to compute NPM
System: Resolve “NPM” formula → (SUM(Profit) / SUM(Sales)) * 100.
Example B :
User: “Show Average Shipping Cost Ratio across all Customer Segments.”
Use Average Shipping Cost Ratio(ASCR) calculation from Knowledge Document (RAG) is used to compute NPM
System: Resolve “Average Shipping Cost Ratio” formula → (SUM(Shipping Cost) /SUM(Sales)) * 100.
Knowledge Document (RAG)
Financial Performance KPIs:

KPI 1 - NPM - Net Profit Margin (%)
NPM Definition: The percentage of revenue that remains as profit after all costs.
Formula: (SUM(Profit) / SUM(Sales)) * 100

KPI 2 - Average Order Value (AOV)
AOV Definition: The average revenue generated per unique order.
Formula: SUM(Sales) /COUNT_DISTINCT(Order ID)

Operational Efficiency KPIs:

KPI 3 - Average Shipping Cost Ratio (ASCR)
ASCR Definition: The percentage of sales consumed by shipping expenses.
ASCR Formula: (SUM(Shipping Cost) /SUM(Sales)) * 100

KPI -4 - Order-to-Ship Cycle Time (O2S)
O2S Definition: The average time taken to process and ship an order.
Formula: AVERAGE (Days (Order Date - Ship Date))
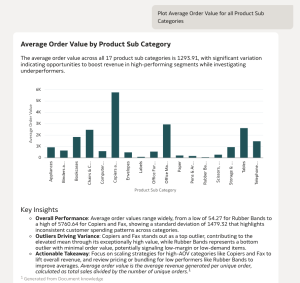
Sample Utterances
When the user asks, "Plot Average Order Value for all Product Sub Categories"
Adding Dictionaries or Value Mappings Using Knowledge Documents
In some cases, users may ask questions using terms that do not directly match the values stored in the dataset. For example, a user may ask about a country, while the dataset only contains a Region column. Because the relationship between the user’s terminology and the dataset values is not explicitly defined, the LLM may not automatically understand the correct mapping. To address this, organizations can document equivalent values or dictionary mappings in a knowledge document. These mappings can then be uploaded as Knowledge Documents within an AI Agent.
When a user asks a question that requires such a translation, the agent retrieves the relevant mapping information from the knowledge document and uses it to correctly interpret the user’s request before generating results. This ensures the query aligns with the structure and terminology of the dataset.
Note:
Mappings work best when they are directly available within the dataset itself (for example, through a mapping table or additional columns). If mappings must be defined in knowledge documents instead, keep the mapping cardinality small and clearly defined to reduce ambiguity and minimize the risk of hallucinations.
Instructions:
Region Mapping Rules:
When a user refers to a geographic area using natural language (such as a continent, country, or regional term), map the user’s reference to the closest matching dataset region and apply that region as a filter.
If mentions any region or country related details, refer the document knowledge (RAG) region mapping rules for exact mapping.
Apply a strict filter using the mapped region value. (Region = "EMEA" and so on)
Knowledge Document (RAG):
Region Mapping Examples:
- If the user mentions Europe, EU, European Union, UK, Middle East, or Africa, map to EMEA
- If the user mentions Asia, India, China, Japan, Southeast Asia, Australia, or Asia-Pacific, map to APAC
- If the user mentions Latin America, South America, Central America, or LATAM, map to LAD
- If the user mentions United States, US, USA, Canada, North America, or Americas, map to AMERICAS
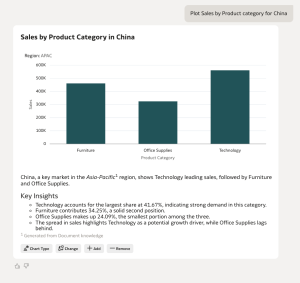
Sample Utterances
When the user asks, "Plot Sales by Product category for China"
Maintaining Persistent Filters Across Conversations
In many analytical scenarios, users interact with the system through a sequence of related queries rather than isolated, one-time requests. During this interaction, users often apply filters (such as Region, Time Period, Product, or Customer Segment) that define the context of analysis.
If these filters are not consistently maintained, the system may produce results that appear inconsistent or misleading, forcing users to repeatedly reapply the same conditions. This disrupts the conversational experience and reduces efficiency.
To address this, AI Agents are designed to retain and carry forward previously applied filters throughout the same conversation, unless the user explicitly changes or removes them. This ensures continuity, improves usability, and aligns responses with user intent over time.
Instructions:
Always maintain and carry forward all previously applied filters within the same conversation unless explicitly modified or removed by the user.

Behavior Rules:
1. Any filter applied in a prior user query must persist into subsequent queries.
2. If the user asks a follow-up question without specifying filters, reuse all previously applied filters.
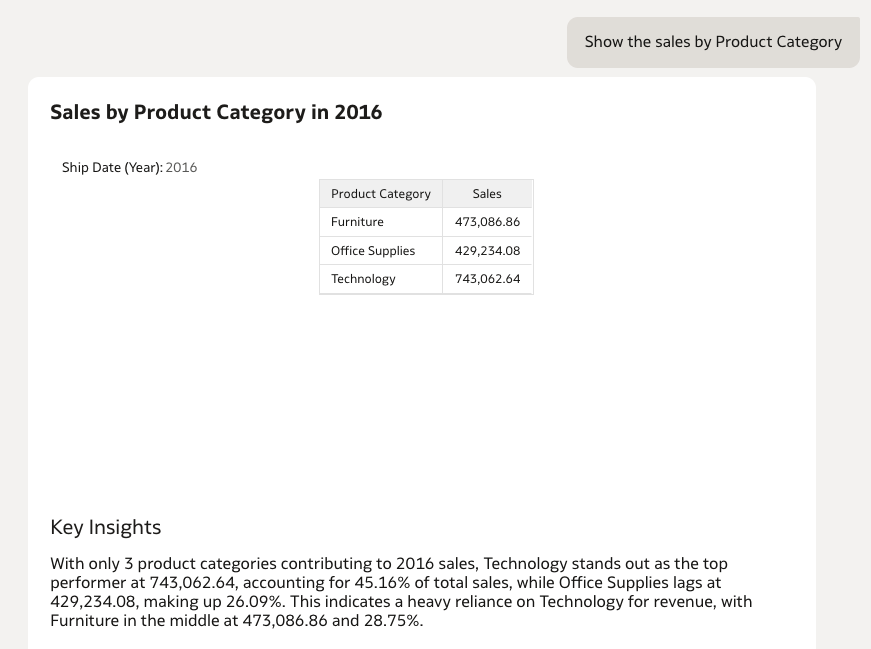
Sample Utterances
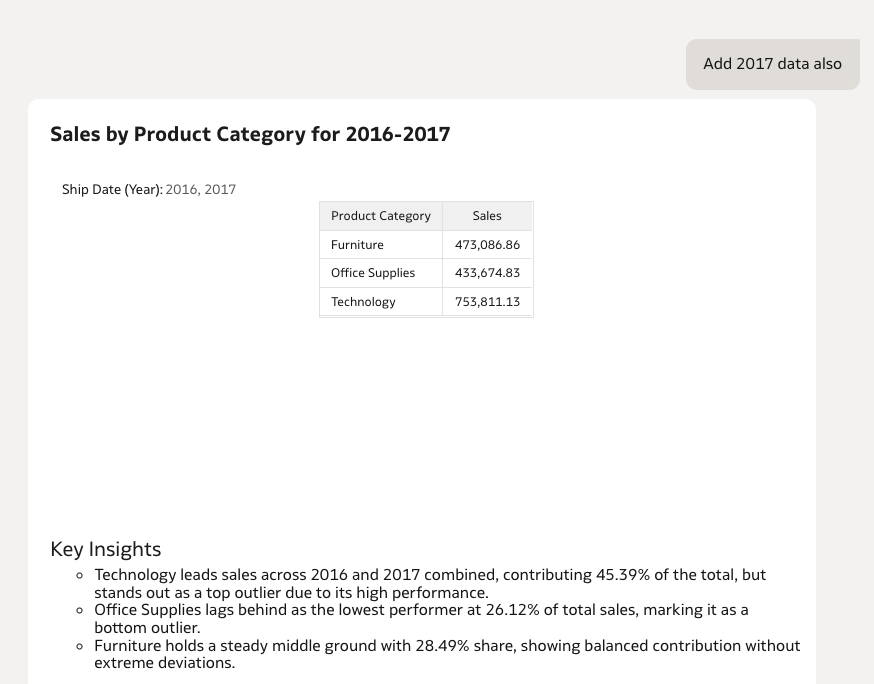
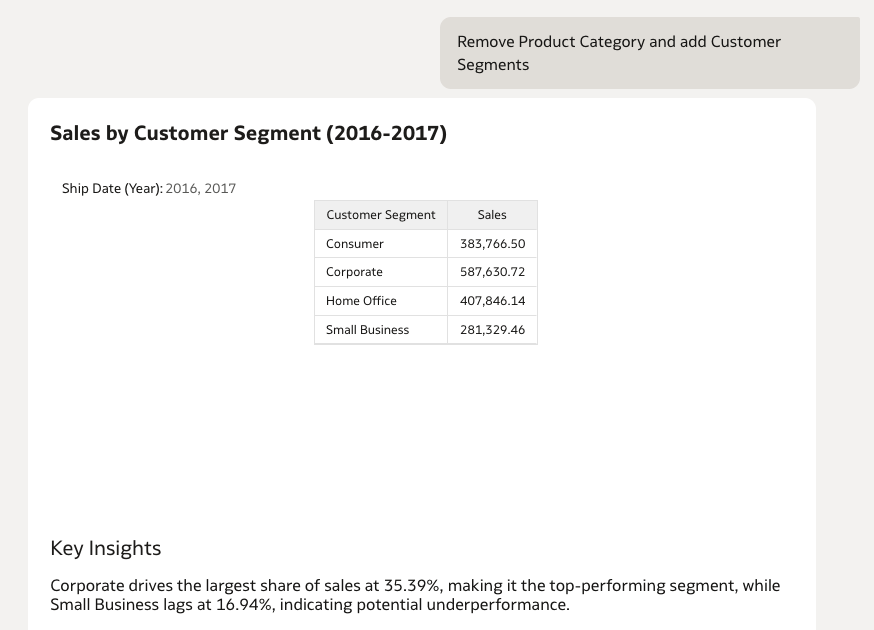
When the user asks,
"Show the sales by Product Category" | Folllow up → "Add 2017 Data also" | Follow up→ "Remove Product Category and add Customer Segments"
|
|---|
|
|
|
Standard Average Calculations
In many analytical scenarios, users ask questions related to average-based metrics. Using the default aggregation method, such as AVG(Metric), may not always produce results that align with business expectations or remain consistent across analyses.
To ensure consistent and meaningful average calculations, AI agents should use an explicit calculation methodology rather than relying solely on the default average aggregation behavior.
When an average metric is requested, the calculation should be based on a clearly defined denominator (using an existing column). This approach ensures that the resulting values accurately reflect business intent, remain consistent across reports and queries, and provide a stable interpretation of average-based metrics over time.
Instructions:
Average Calculations

When answering average, avg, or average-related questions on any metric:

1. Do not use the default AVG aggregation for the metric.
2. Calculate the average as:
   SUM(metric) / SUM(Quantity Ordered)
3. Treat Quantity Ordered as the default denominator for all average metric calculations unless the user explicitly specifies a different denominator.
4. Apply the calculation at the requested level of aggregation.
5. Preserve all requested grouping dimensions, such as Year, Product Category, Region, Customer Segment, or any other categories.

Examples:
- Average Sales by Year = SUM(Sales) / SUM(Quantity Ordered) grouped by Year.
- Average Profit by Product Category = SUM(Profit) / SUM(Quantity Ordered) grouped by Product Category.
Sample Utterances
When the user asks, "Give me Average Profits by Cities as Bar Chart"
Note: The above approach is applied to all metrics available in the dataset by default. If the average calculation rule should apply only to specific metrics, modify the instructions to explicitly identify those metrics and define the corresponding calculation logic. This helps ensure that the agent applies the intended averaging methodology only where appropriate.


