This is an OAC dashboard built to address the challenge in project portfolio financial management — specifically, the difficulty of identifying budget overruns, cost anomalies, and resource risks across a large and complex portfolio in a way that is both immediate and actionable.
1. Which dataset did you use?
The Project Portfolio Management (PPM) Subject Area data from Oracle Fusion was used in building this workbook. This subject area surfaces data directly covering project budgets, burdened costs, committed costs (open POs and requisitions), ETC, EAC, labor hours, resource classes, and task-level expenditures.
2. How did you analyze or prepare the data?
I analyzed the dataset using OAC AI Insights. Using the charts in the insights I was able narrow down on the data anomalies present, the outliers for different attributes, presence of null factors that could render the visualization incorrect. On the basis of this I proceeded to build calculated measures directly in OAC to derive the key metrics, including EAC vs Budget Variance, Budget Variance %, ETC, and Commitment Coverage % that would help deliver insights on the data.
3. Who is the intended audience?
The primary audience is managers and financial controllers responsible for overseeing project spend across the organization. Secondary audience is executive leadership who need a high-level financial health check, specifically the KPI tiles and overrun alert, without drilling into project-level detail.
4. What is your visualization about, and what question does it address?
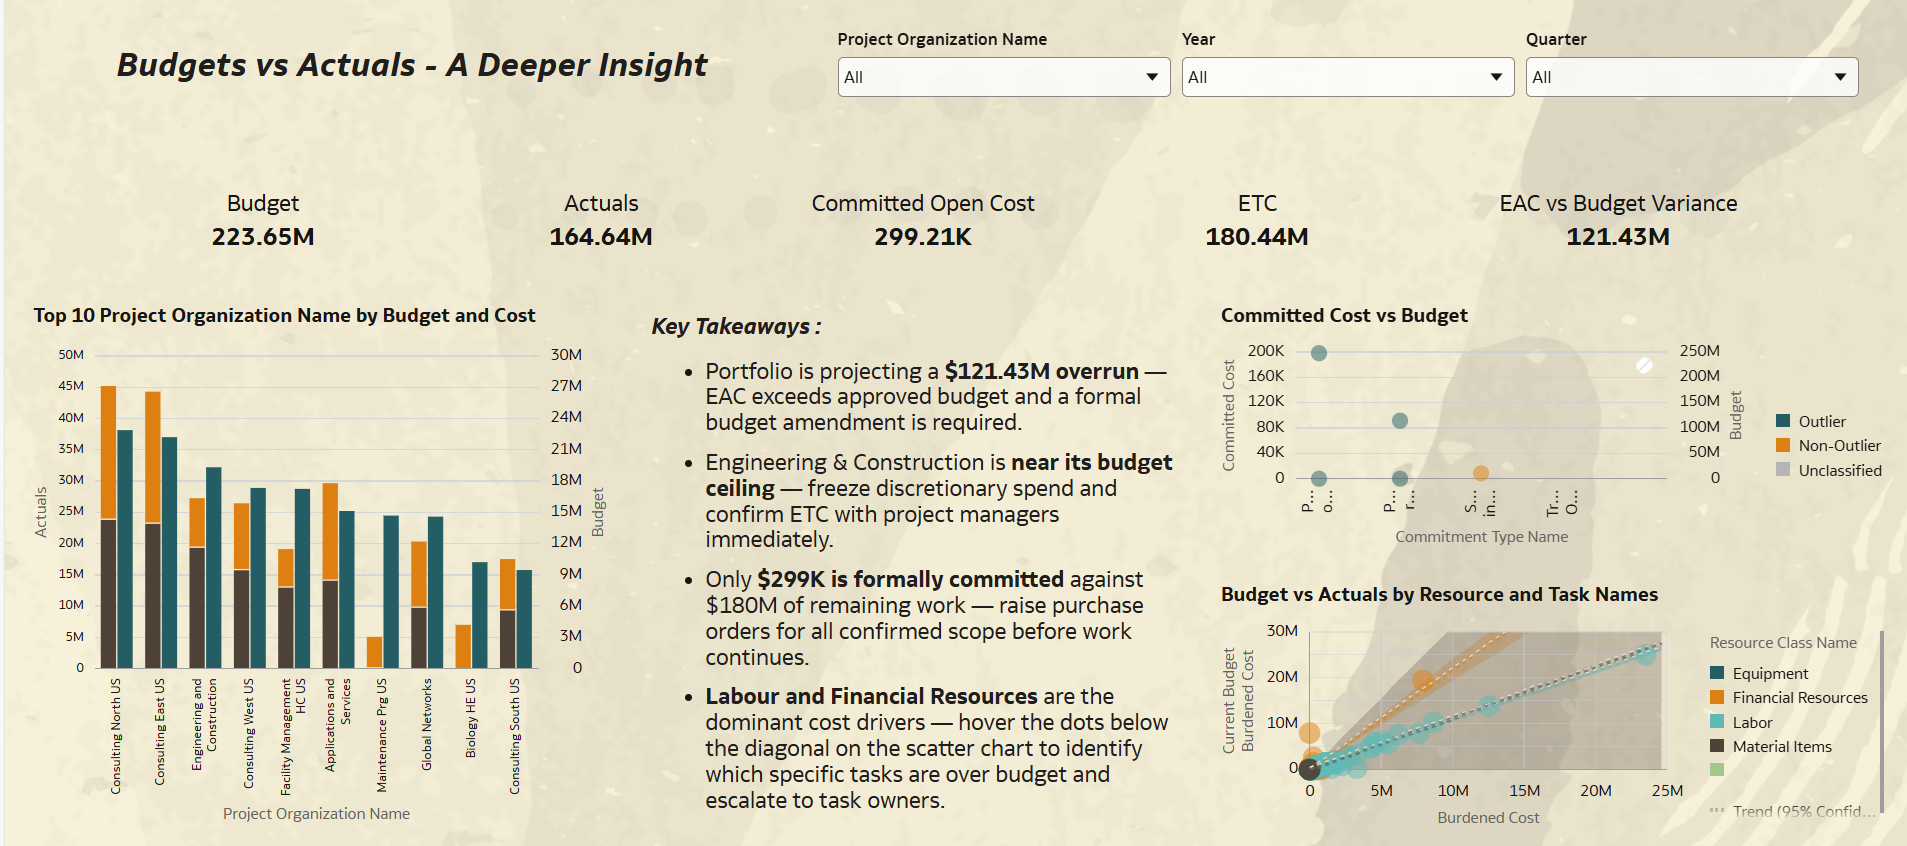
The dashboards answer one core question: "Is our project portfolio delivering within its approved budget, and where are the risks?" The Portfolio Overview page gives the headline financial position. The Budgets vs Actuals page breaks this down by organization, commitment type, and resource class to identify where the overrun is originating, which organizations are near their budget ceiling, and which cost types are driving overspend.
5. Did you use any Oracle Analytics AI features?
Yes. I used OAC AI Insights to refer to different visualizations and analytic charts that could be used instead of regular ones. For example, the Pareto Chart was an insight from that which I tweaked to match what I intended to explain.
Attaching the Budgets vs Actuals Page below: