Oracle Communities
Oracle Analytics and AI
Child Item
Home
Oracle Analytics and AI
Oracle Analytics and AI Labs
Oracle Analytics Data Visualization Gallery
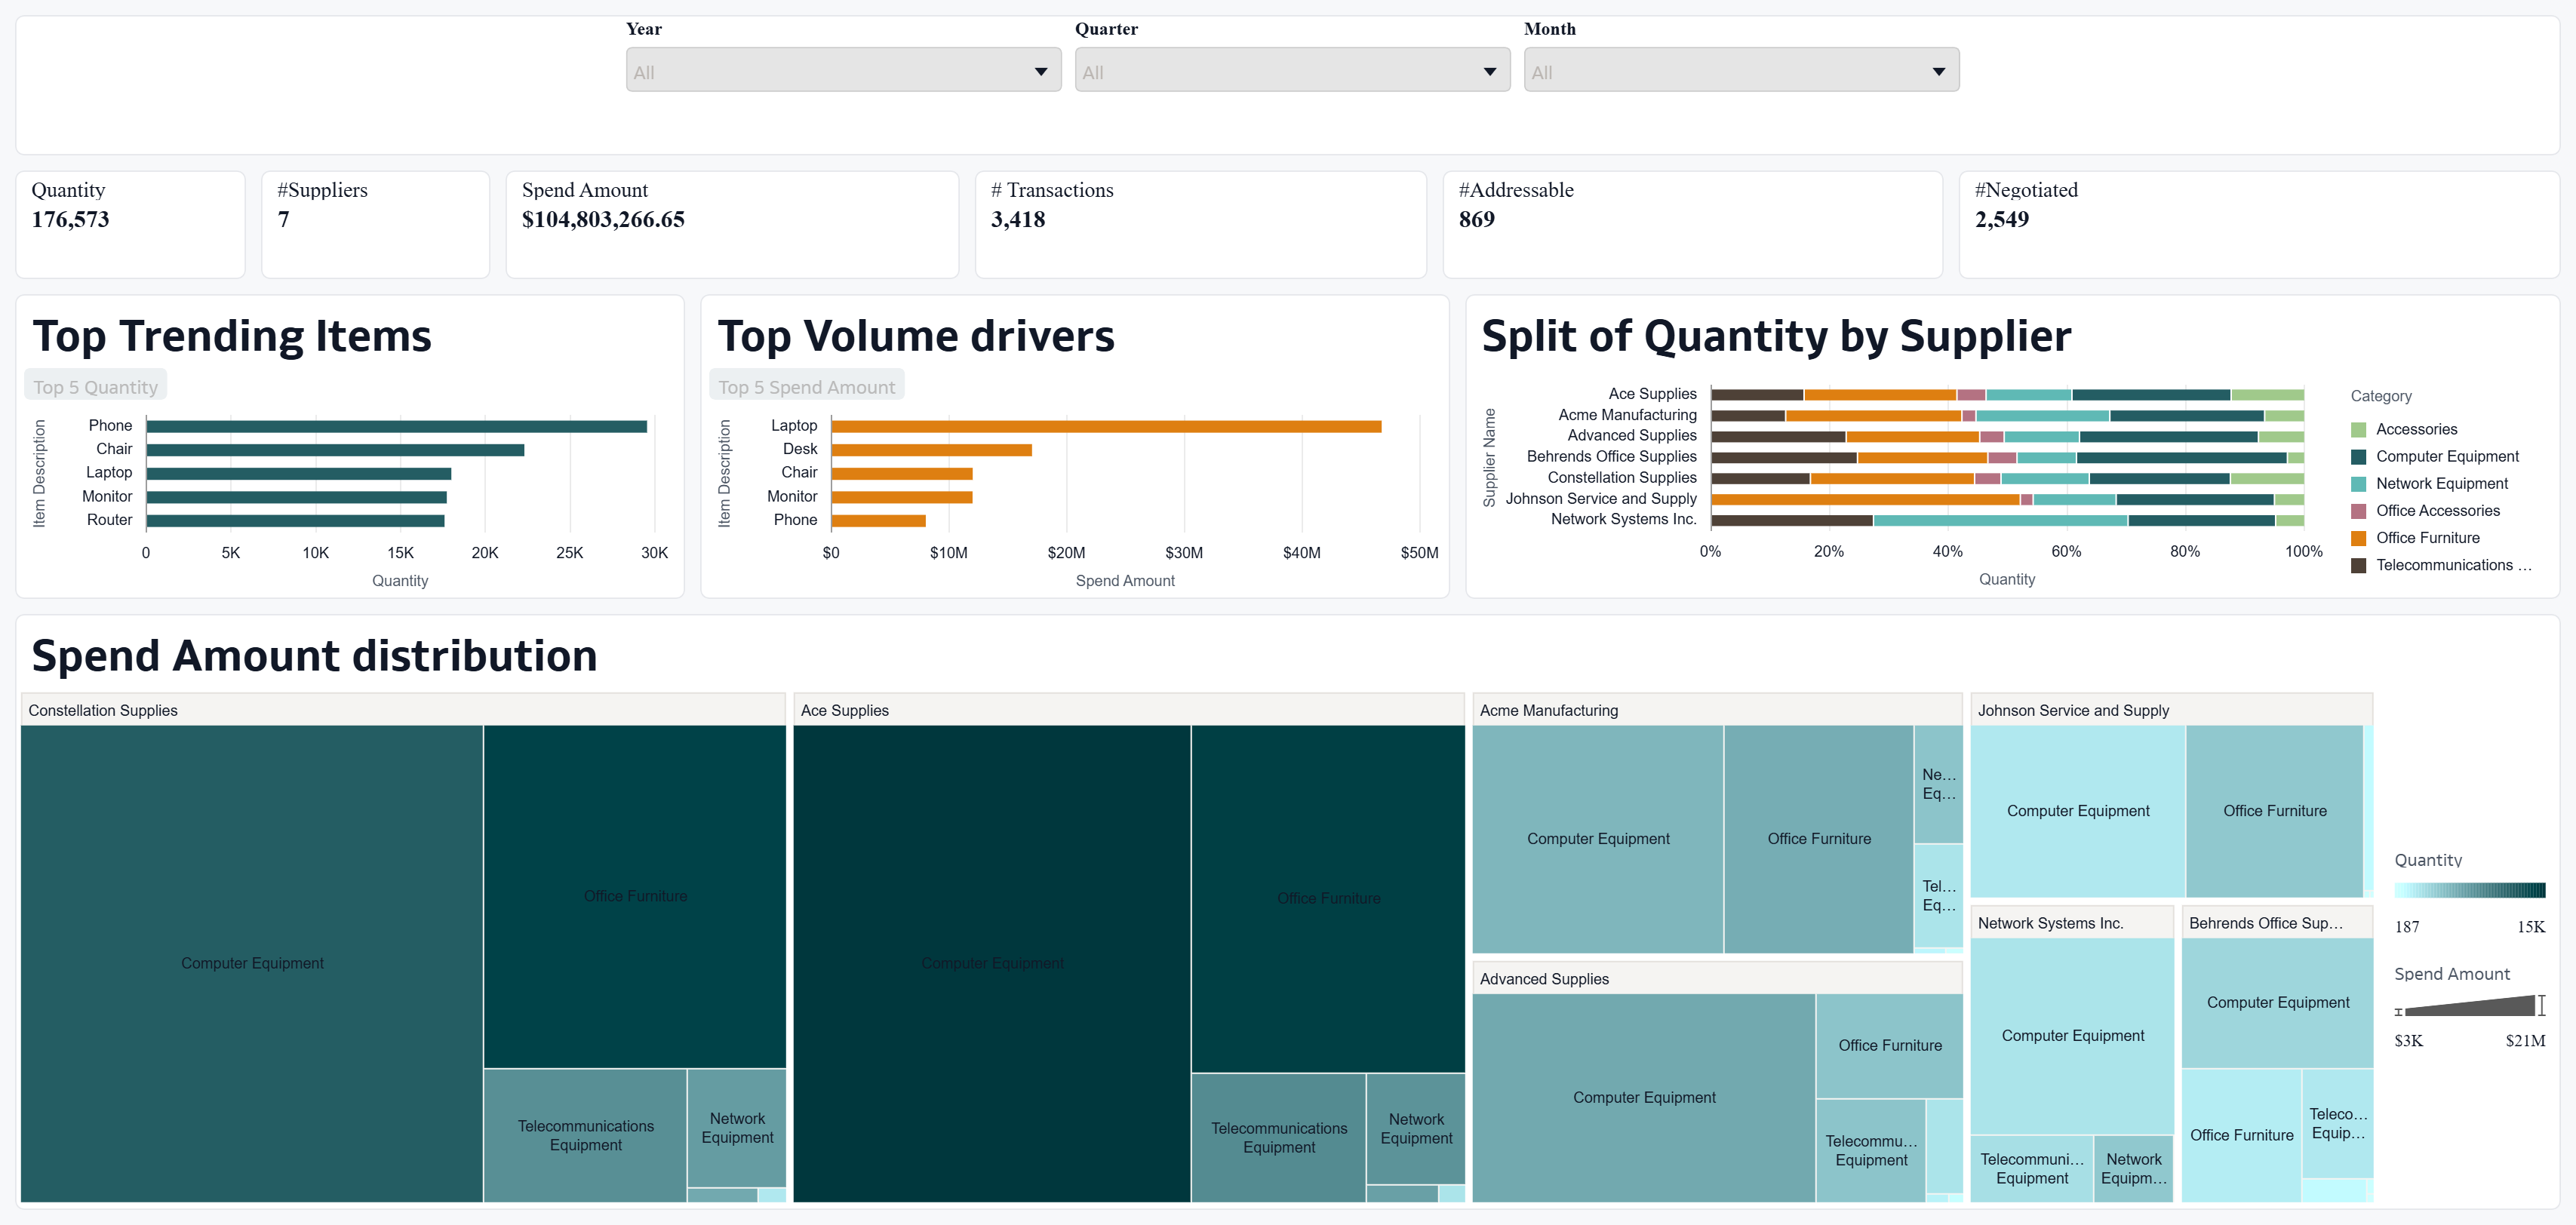
Supplier Spend Analysis
Meghashree S-Oracle
Which dataset did you use?
I used the Spend Transactions data provided by the Oracle.
How did you analyze or prepare the data?
I analysed each attribute and measure with different visualizations, Understood the relationship between them and chose the best visualizations.
Who is the intended audience for your visualization?
Finance team to analyze the spend distribution and optimize the spend.
What is your visualization about, and what question or problem does it address?
The visualization is used to analyze the spend distribution across supplier and category to optimize the spend amount.
It helps to analyze if spend is concentrated on any single supplier or category or cost center.
Did you use any Oracle Analytics AI features when building your visualization (ex. AI Assistant)? If so, please describe how they were used
Yes, generate visualizations, auto generated metrics.
Did you upload your visualization image and dva file?
Completed!
supplier-spend-analysis.dva
Find more posts tagged with
Data Visualization
Status: Data Visualization
Comments
There are no comments yet