1. Which dataset did you use?
I used the Spend Transactions dataset provided for the Challenge.
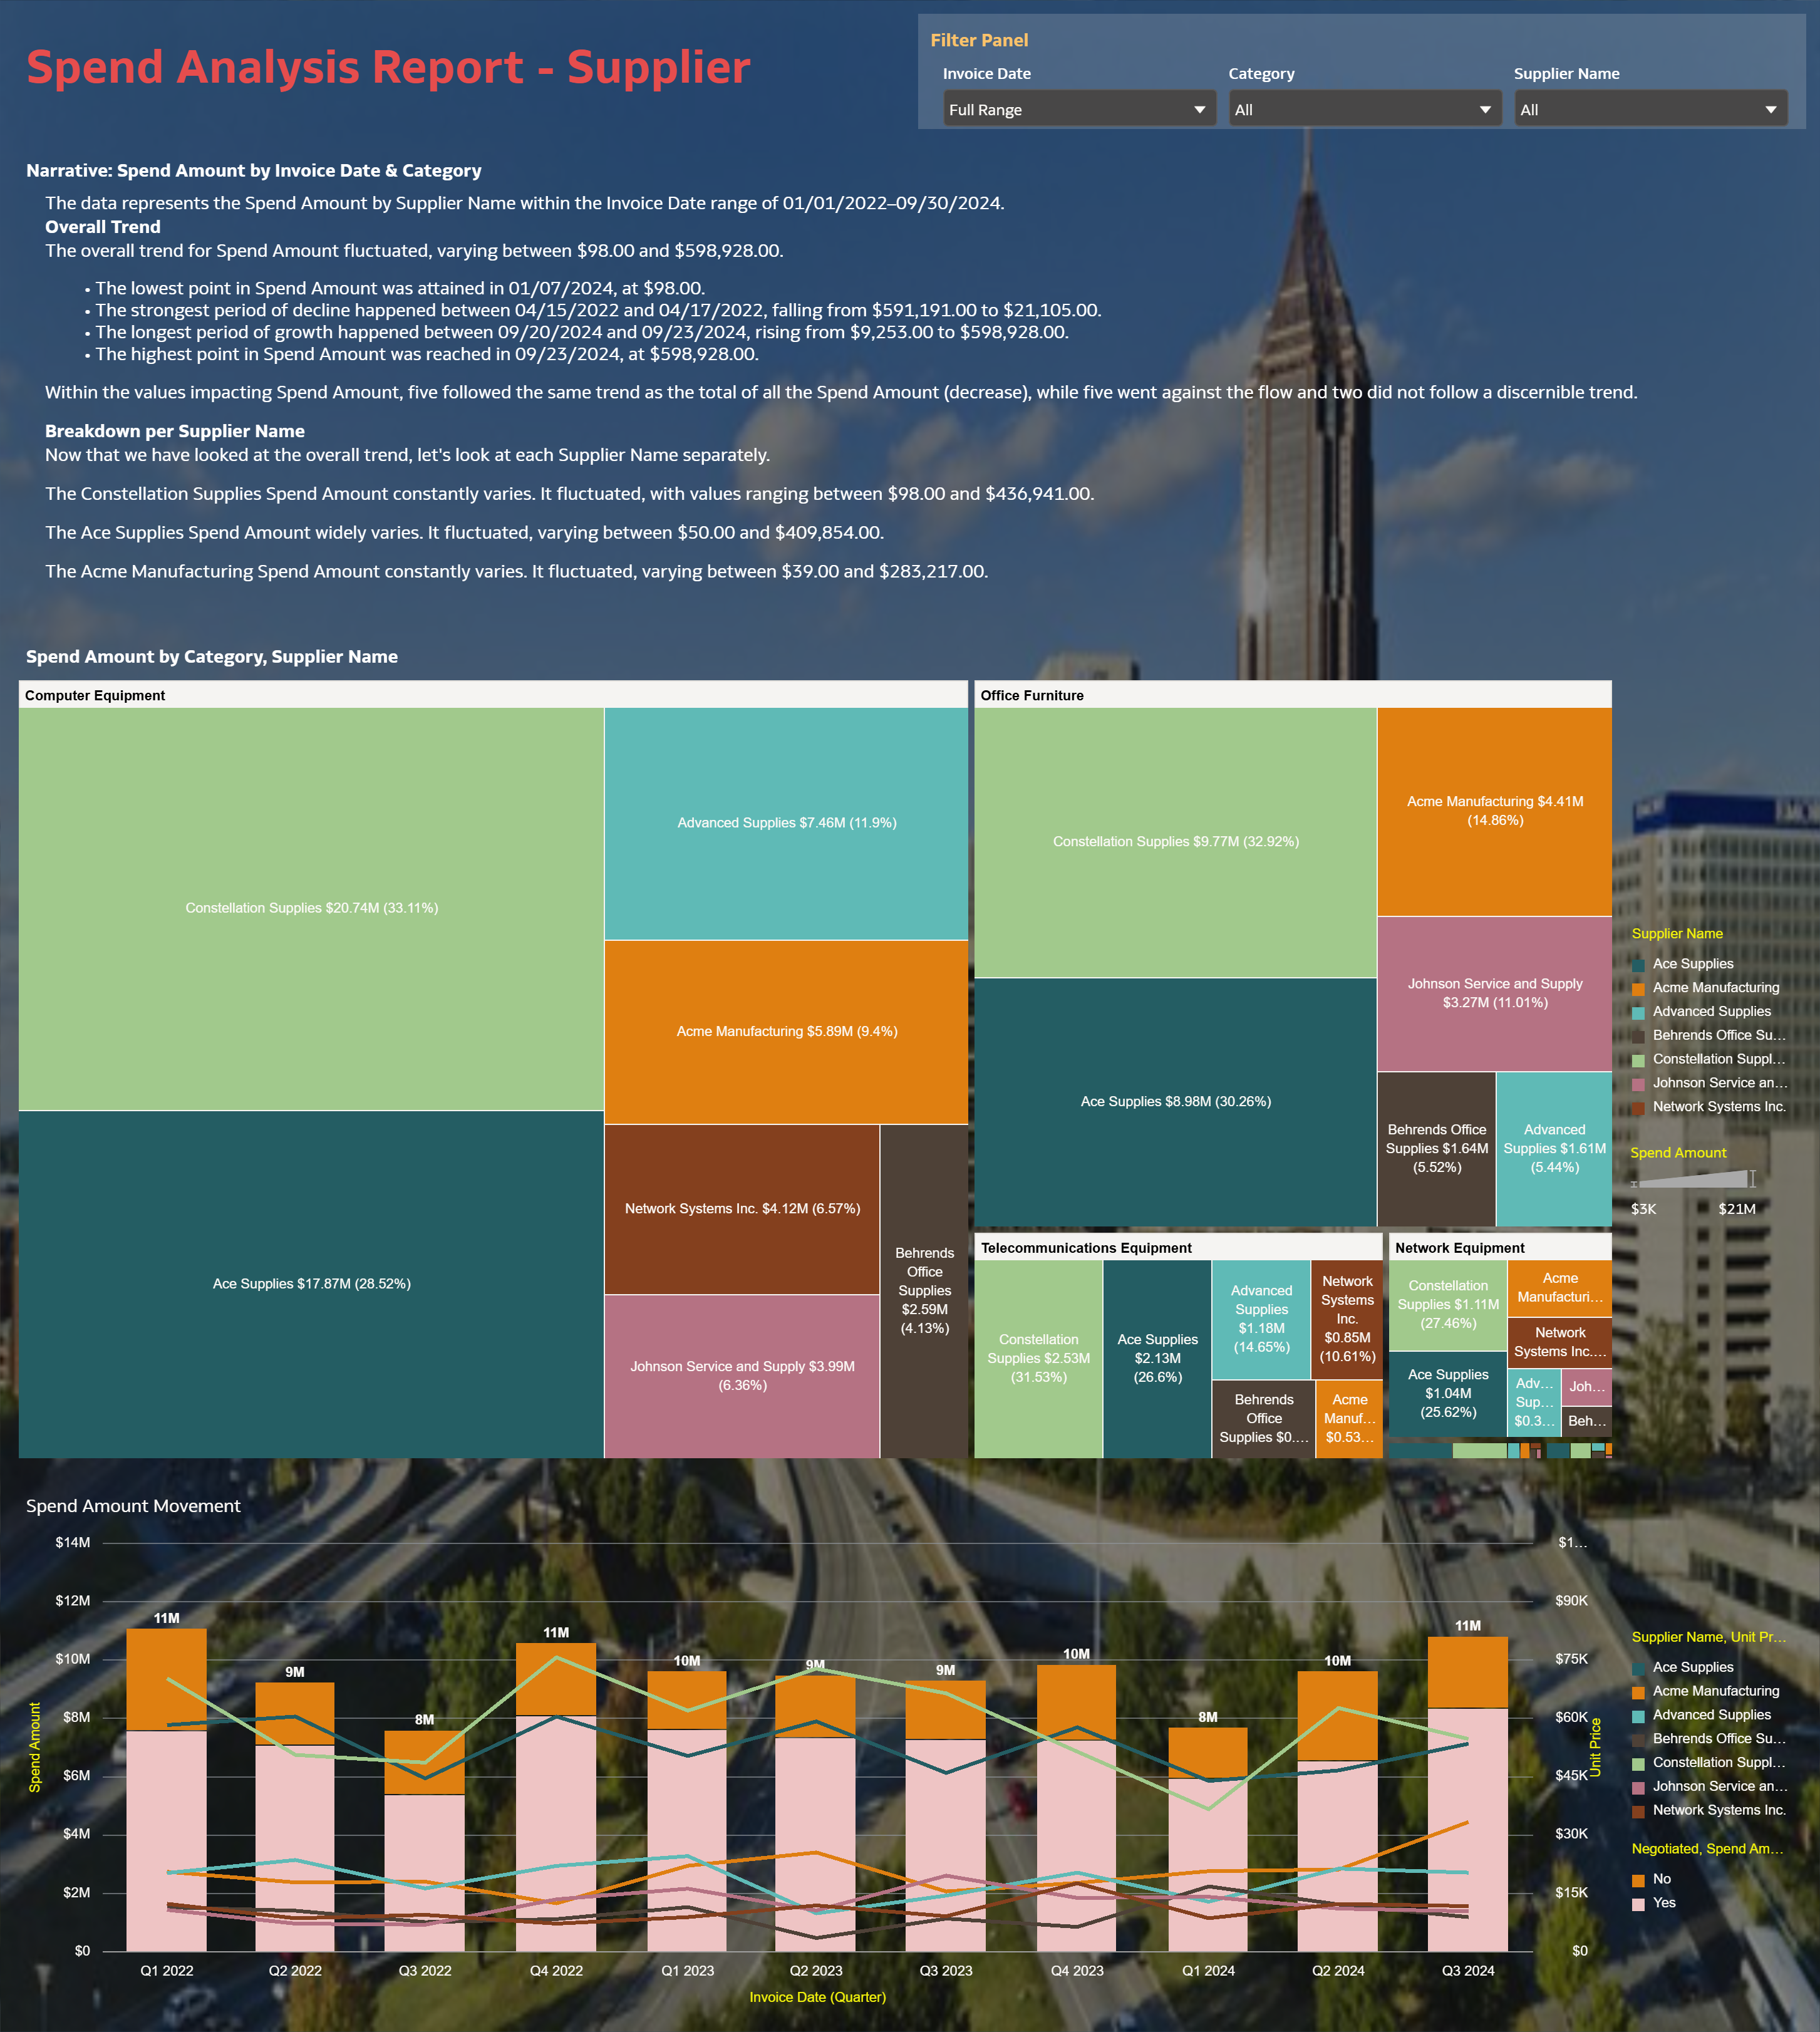
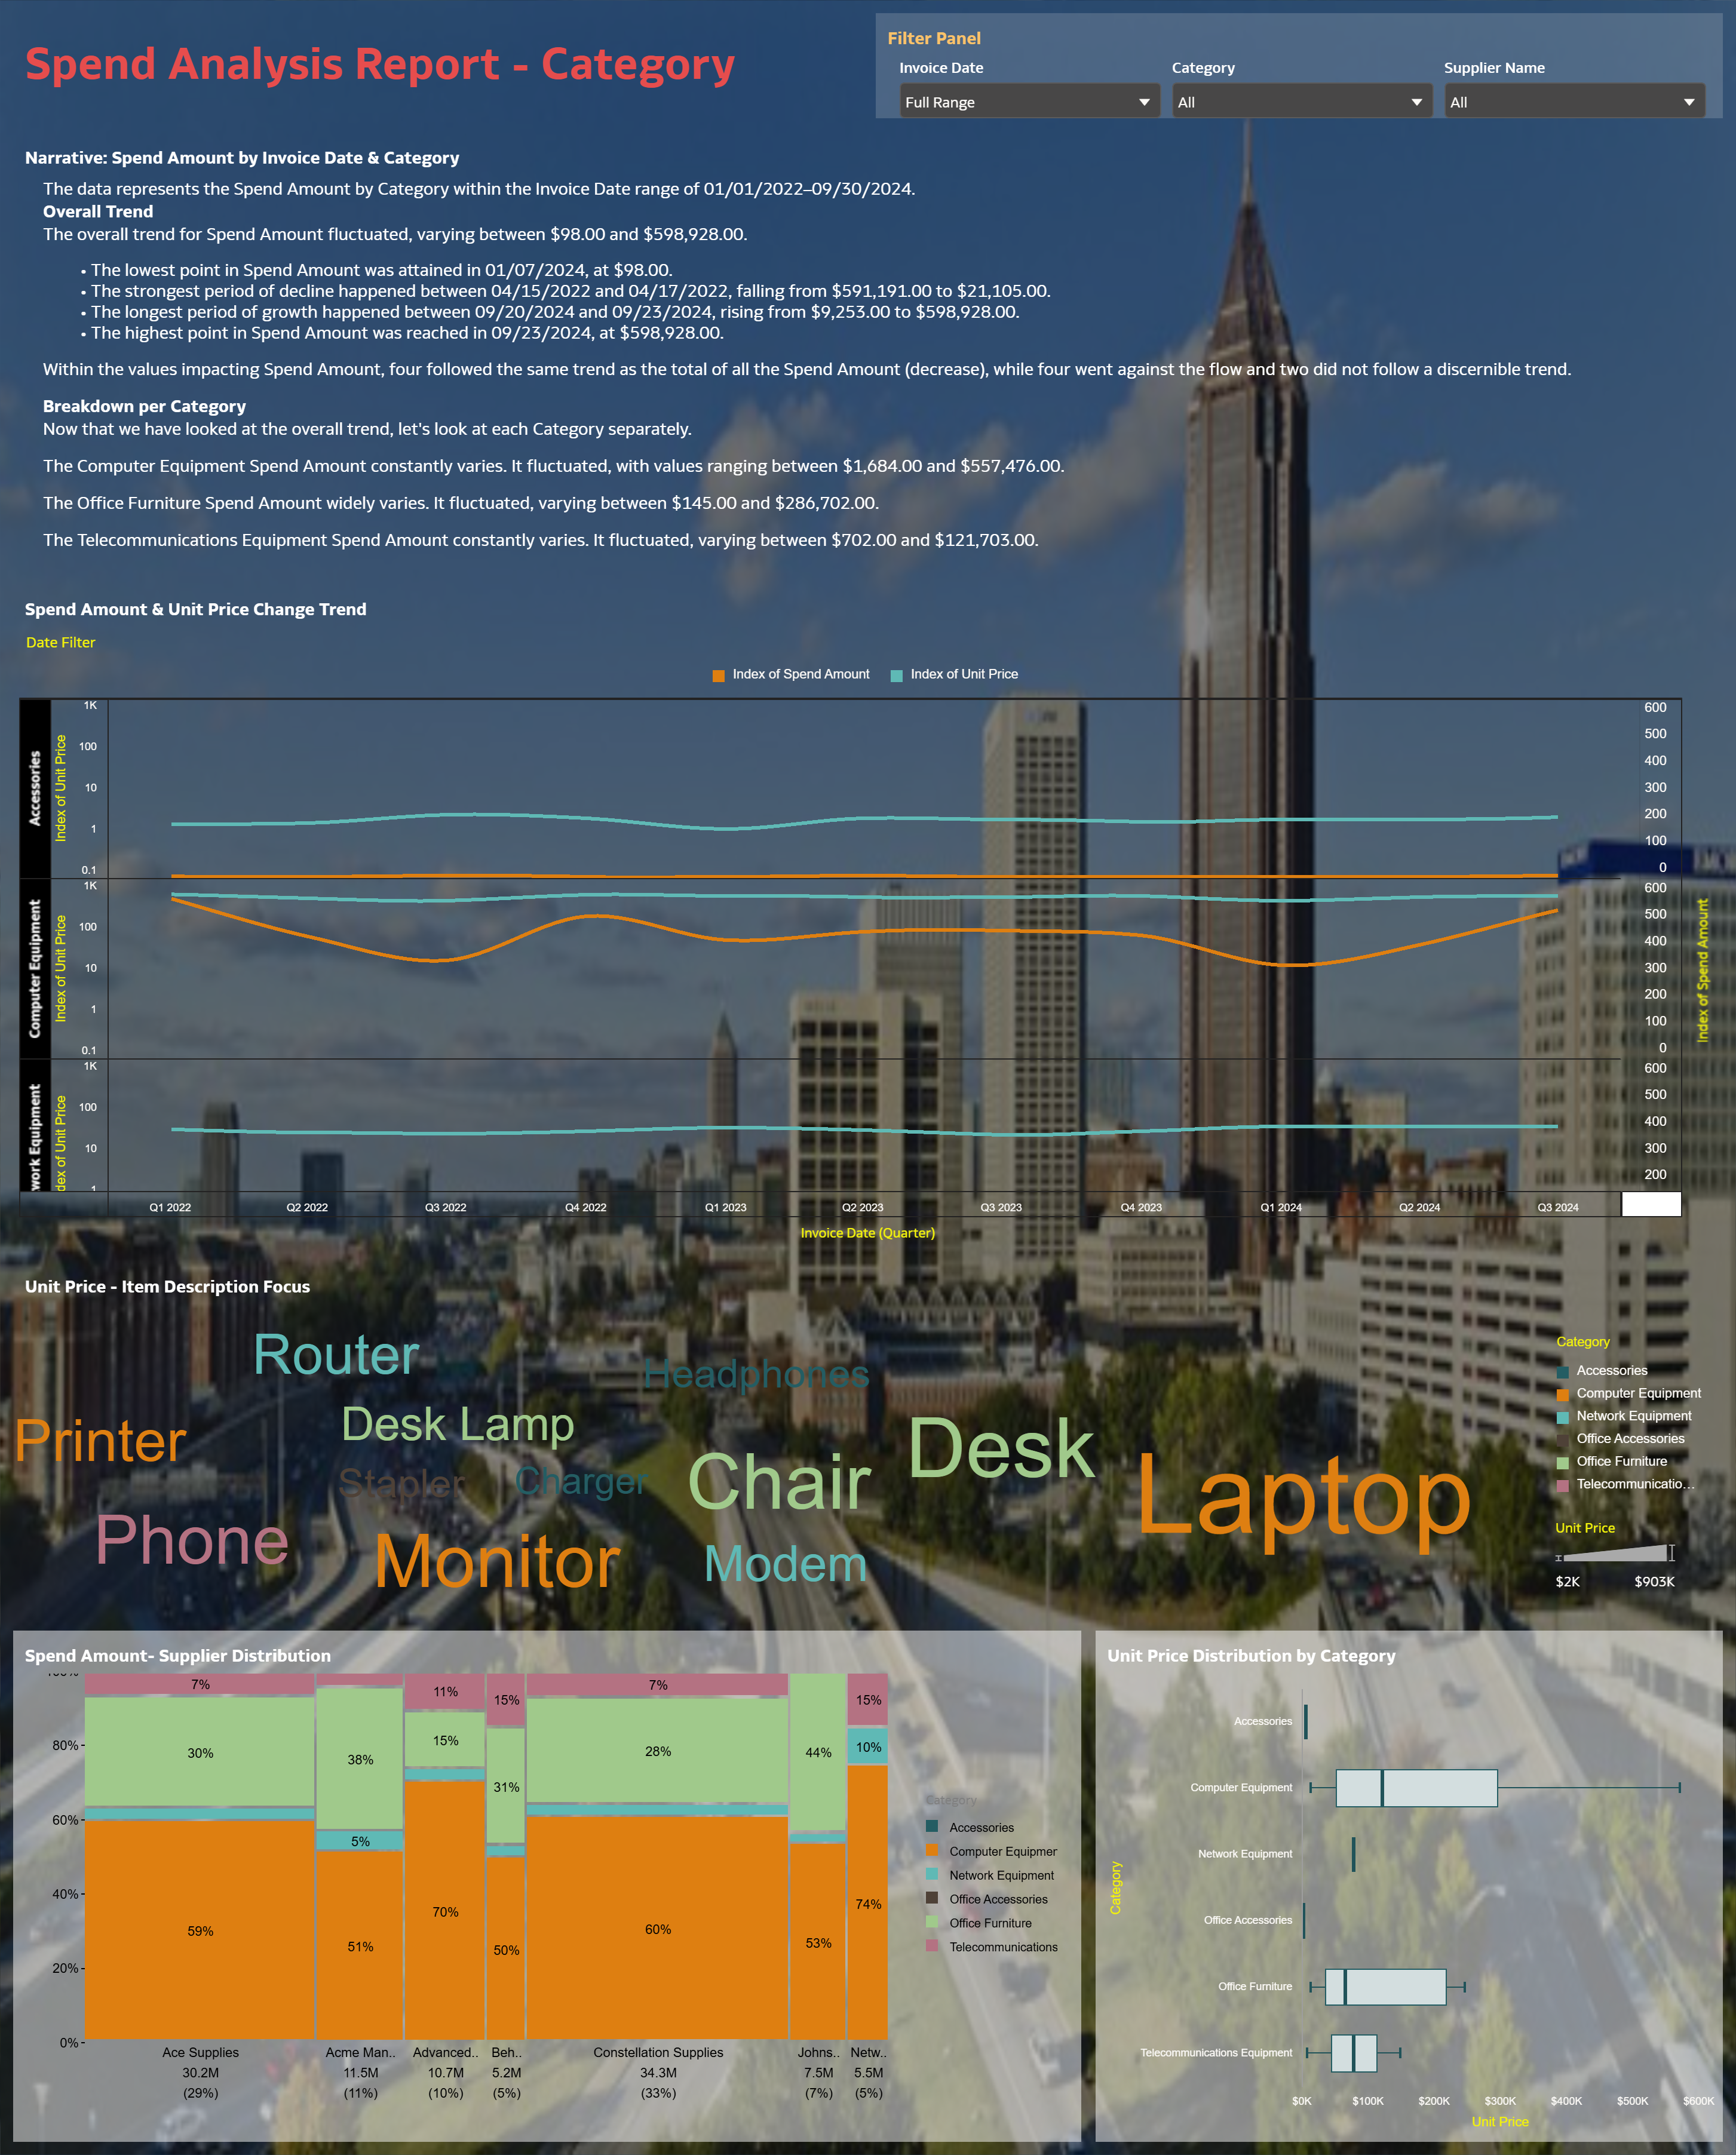
2. How did you analyze or prepare the data?I structured the Spend Transactions fields into analysis-ready attributes and measures, then built interactive views to analyze spend by invoice date, supplier, and category. The workbook is organized into three canvases (Overview, Supplier, Category) with filters and drilldowns so users can move from summary KPIs to detailed breakdowns.
3. Who is the intended audience for your visualization?Chief Procurement Officer (CPO) and Category Managers.
4. What is your visualization about, and what question or problem does it address?This visualization provides a procurement spend analysis that highlights spend trends and supplier/category concentration, enabling procurement leaders to quickly identify where spend is concentrated and where anomalies may require governance or sourcing actions. It supports decision-making by letting users explore spend patterns at both executive summary and drilldown levels across Supplier and Category perspectives.
5. Did you use any Oracle Analytics AI features when building your visualization (ex. AI Assistant)? If so, please describe how they were used.Yes. I used Auto Insights to surface key patterns/outliers and GenAI language narrative to generate concise executive-ready commentary within the visualization.
6. Did you upload your visualization image and dva file?Yes. I uploaded the visualization image(s) and the workbook export (.dva) with my submission.


