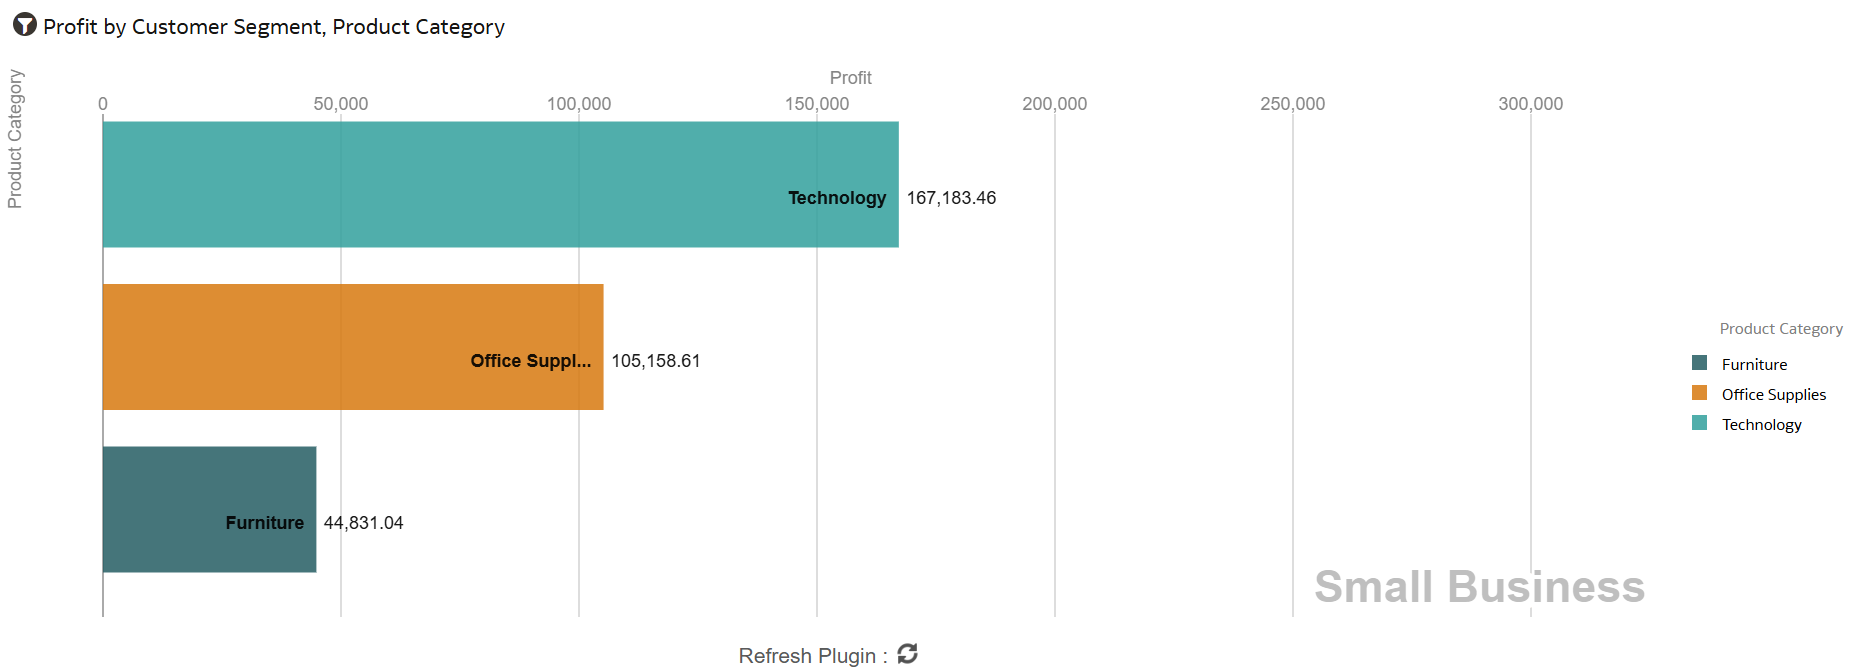
The Racing Bar custom extension displays data as an animated bar chart showing how values evolves across a third dimension like time. As the data changes, the bars dynamically reorder and “race” across the chart, making it easier to observe trends, shifts in ranking, and relative movement between categories over time.
Learn more about the extension here.
You can download the extension zip file here:
Upload the zip file into Oracle Analytics Cloud instance by navigating to Console→Extensions and you start adding the visualization to your workbooks.
Important:
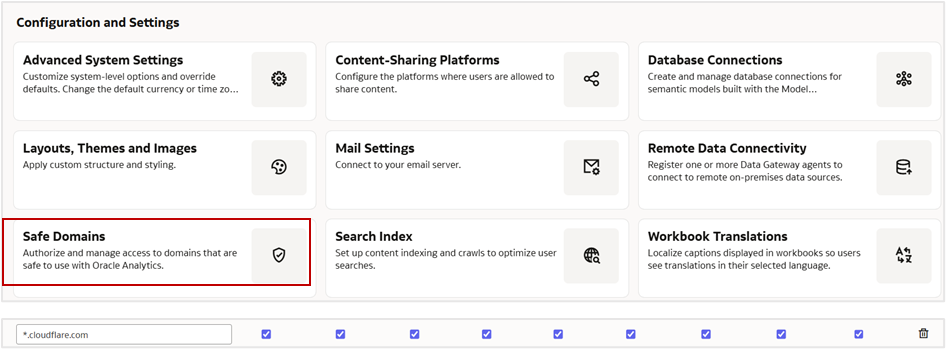
Ensure to whitelist the domain ‘*.cloudflare.com’ under Safe Domains in your Oracle Analytics instance.