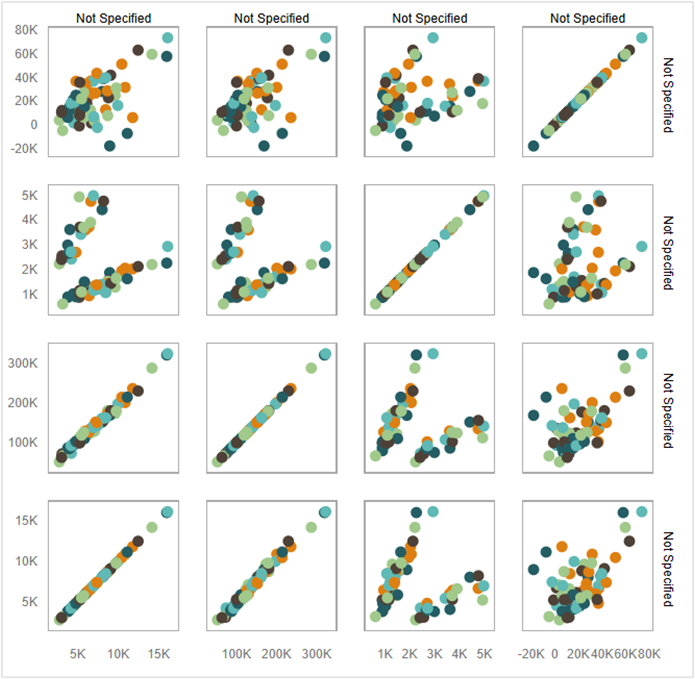
The Scatter Plot Matrix custom extension visualizes relationships among multiple variables using a grid of scatter plots. Each cell in the matrix represents the interaction between a pair of variables, allowing users to explore correlations and patterns across an entire dataset in a single view.
Learn more about the extension here.
You can download the extension zip file here:
Upload the zip file into Oracle Analytics Cloud instance by navigating to Console→Extensions and you start adding the visualization to your workbooks.
Important:
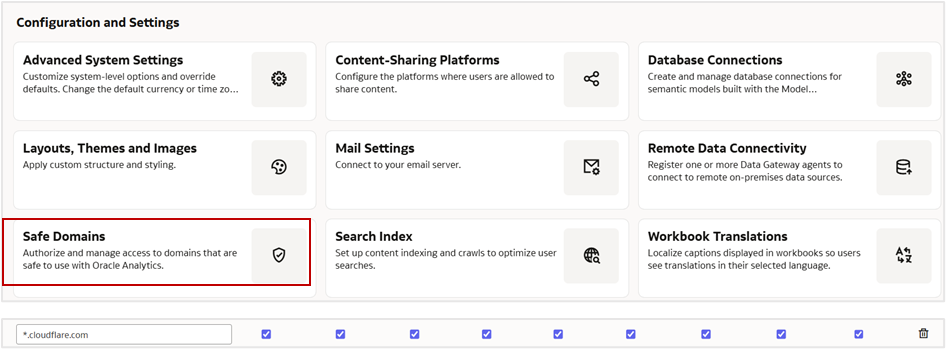
Ensure to whitelist the domain ‘*.cloudflare.com’ under Safe Domains in your Oracle Analytics instance.