Categories
- All Categories
- Oracle Analytics and AI Learning Hub
- 53 Oracle Analytics and AI Sharing Center
- 20 Oracle Analytics and AI Lounge
- 293 Oracle Analytics and AI News
- 57 Oracle Analytics and AI Videos
- 16.4K Oracle Analytics and AI Forums
- 6.5K Oracle Analytics and AI Labs
- Oracle Analytics and AI User Groups
- 116 Oracle Analytics and AI Trainings
- 21 Oracle Analytics and AI Challenge
- Find Partners
- For Partners
FDI Span of Control that Matches HCM View
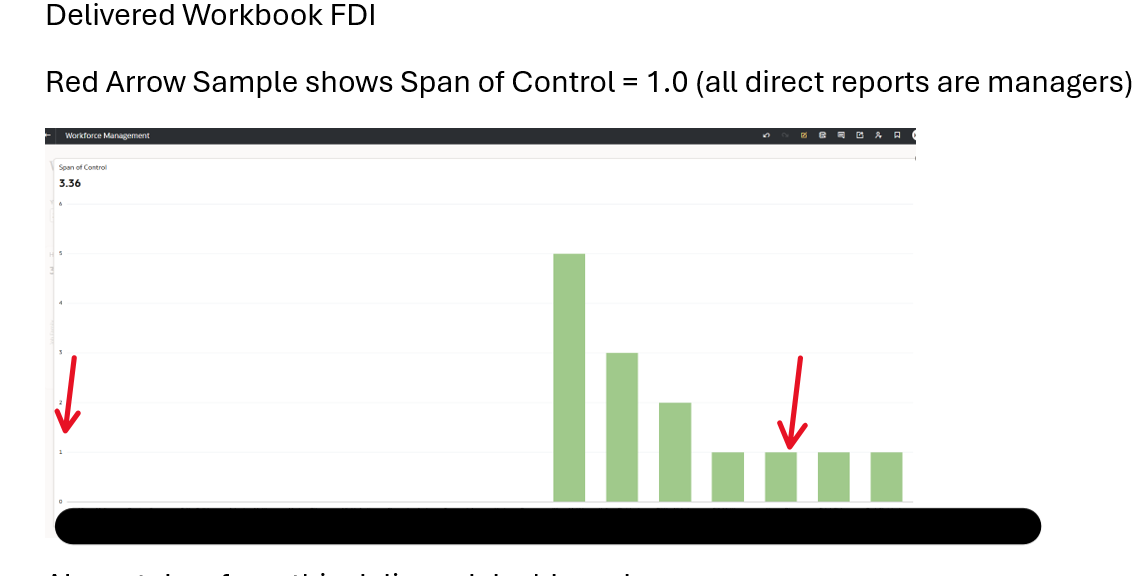
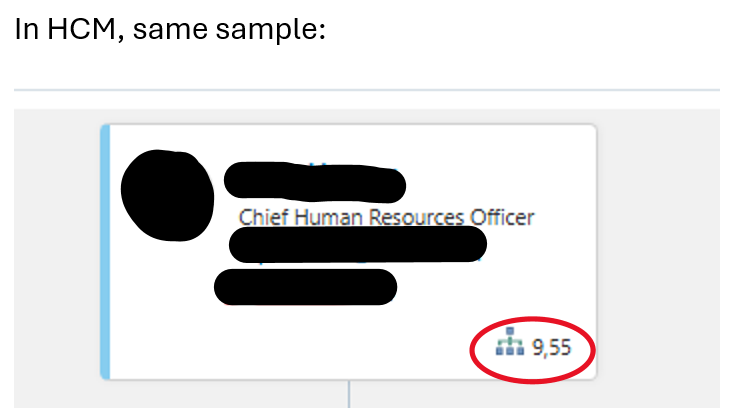
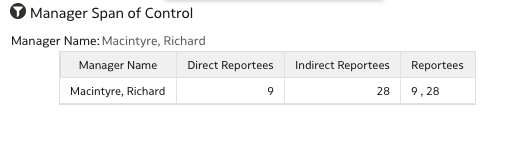
We have been struggling with FDI's version of Span of Control. For example, a manager who has 9 direct reports in HCM shows "9" in the Org chart but in FDI their SOC is "1" because each of their direct reports is a manager. SOC for that manager should be 9. Also, FDI should have a way to represent the 9,55 shown in HCM where 9 is direct reports and 55 is indirect reports.
Comments
-
Hi @Ken Howerton, the Span of Control metric used in the Workforce Management out of the box workbook represents an average span, not the exact count of direct reports for an individual manager.
This metric is designed to provide an aggregated view of the average number of reportees per manager, and it can be analyzed across different workforce structures. However, the HCM Org Chart displays the actual count of direct reports for an individual manager, which is why the values differ.
To view the direct and indirect worker counts under a specific manager, you may consider creating a custom visualization instead of using the Span of Control key metric.
For this purpose, you can use:
- Worker Count metric
- Assignment List Manager Hierarchy dimension
A sample DVA file demonstrating this approach has been shared. Requesting you to download the shared DVA file and verify it at your end. Let us know if you have any questions after reviewing it.
0


