Project Profitability Insights Dashboard (Oracle Analytics Cloud)
Following my earlier publication on Project Portfolio Profitability Insights, I recently built an additional Oracle Analytics Cloud (OAC) dashboard focused on project-level financial analysis.
While the portfolio dashboard helps leadership understand overall financial health across projects, this new dashboard dives deeper into individual project profitability, helping identify cost drivers and margin behavior at the project level.
Together, these two dashboards provide a two-level analytical view:
• Portfolio-level monitoring to identify which projects require attention
• Project-level analysis to understand why profitability is improving or declining
1. Dataset Used
The dashboard uses the Project Portfolio Management (PPM) subject areas from Oracle Fusion.
This dataset provides access to key project financial metrics including:
- Project revenue
- Burdened project costs
- Customer revenue contributions
- Cost distribution across expenditure categories and types
These measures enable a consolidated view of project revenue, cost structure, and profitability drivers.
The dashboard supports analysis for a single project or a selected group of projects, allowing users to evaluate profitability trends and cost structure for individual projects as well as compare a small set of projects.
2. Data Analysis and Preparation
To better understand the dataset structure and value distributions, I explored the data using OAC AI Insights.
AI Insights helped highlight:
- Distribution of revenue and cost across projects
- Patterns in expenditure categories and cost drivers
- Variations in project profitability across fiscal periods
Based on this exploration, I created calculated measures directly in OAC, including:
Profit = Revenue − Cost
Profit Margin %
These derived measures allow the dashboard to present profitability trends and project performance indicators.
3. Intended Audience
The dashboard is primarily designed for:
- Finance Controllers
- Project Controllers
- PMO Analysts
who are responsible for monitoring project financial performance and margin drivers.
It also supports leadership teams by providing a clear view of project profitability trends and cost structure.
4. Key Business Questions Addressed
This dashboard focuses on project-level profitability diagnostics, answering questions such as:
- How profitable is a specific project?
- How do project cost and revenue trends evolve over time?
- Which customers contribute the most revenue to the project?
- What are the primary cost drivers within the project?
- How is project cost distributed across expenditure categories and types?
- How much cost is direct vs indirect?
- What portion of project cost is billable vs non-billable?
- How much project cost is capitalizable vs non-capitalizable?
- What portion of cost is committed vs already incurred?
These insights help project and finance teams understand why project profitability changes over time.
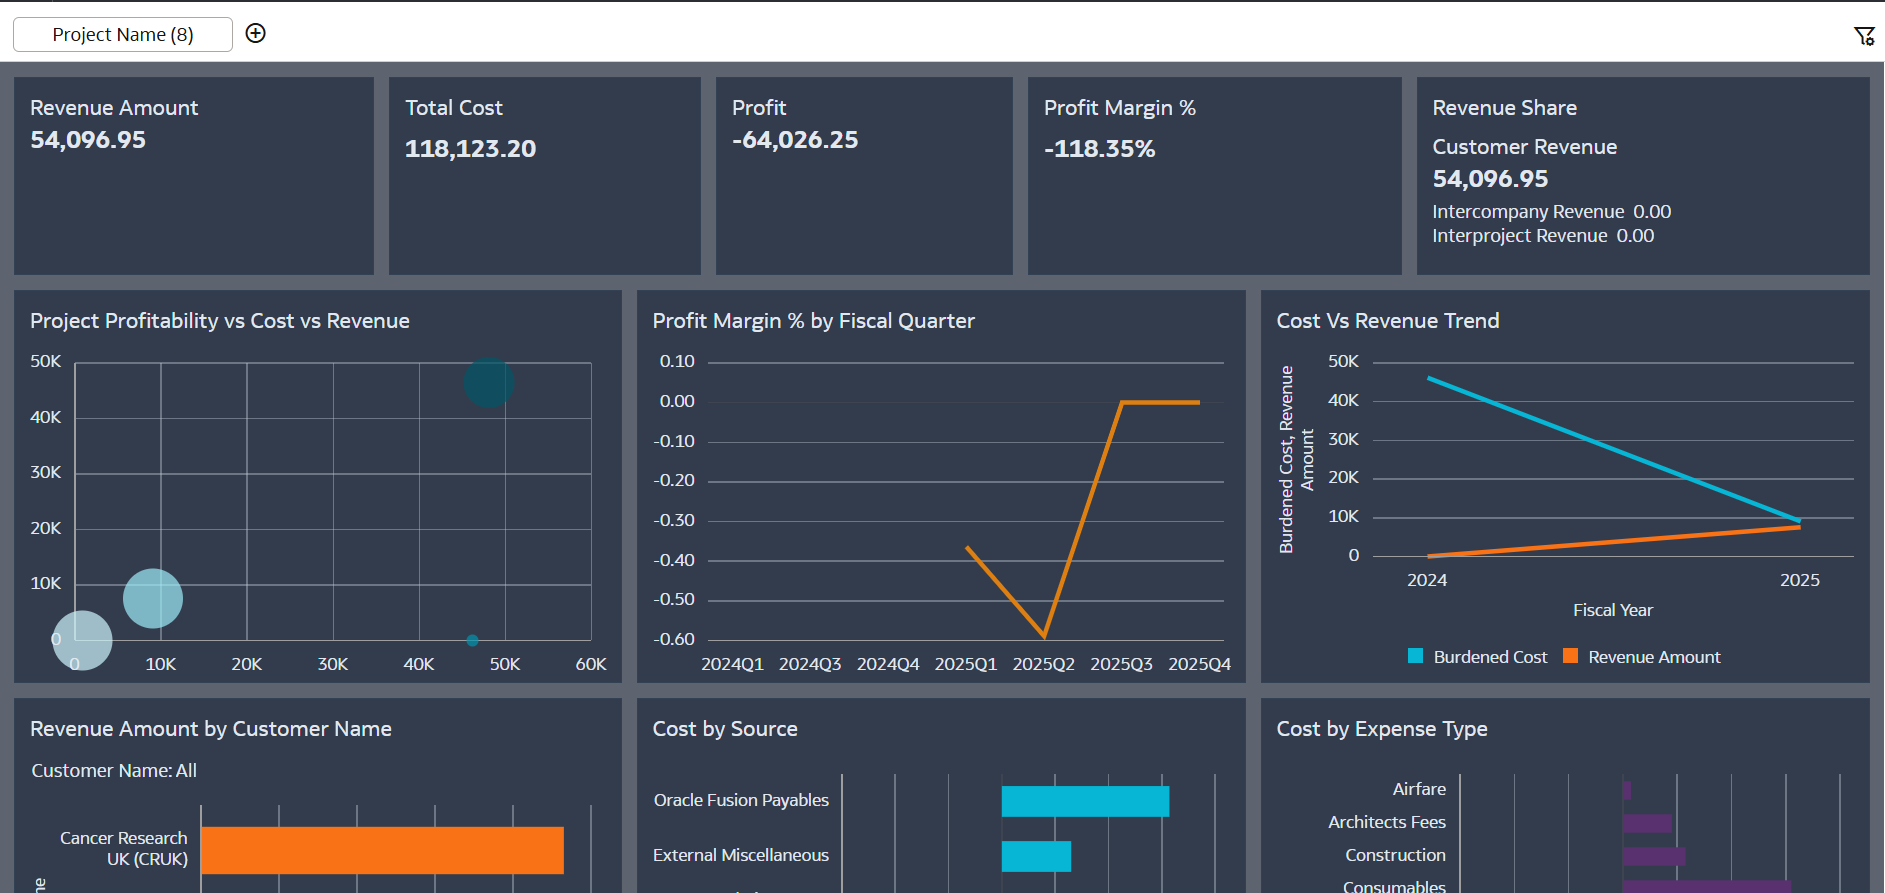
5. Example Insights from the Dashboard
The dashboard includes visualizations such as:
- Project Cost vs Revenue trend analysis
- Profit Margin % by fiscal quarter
- Project profitability scatter analysis
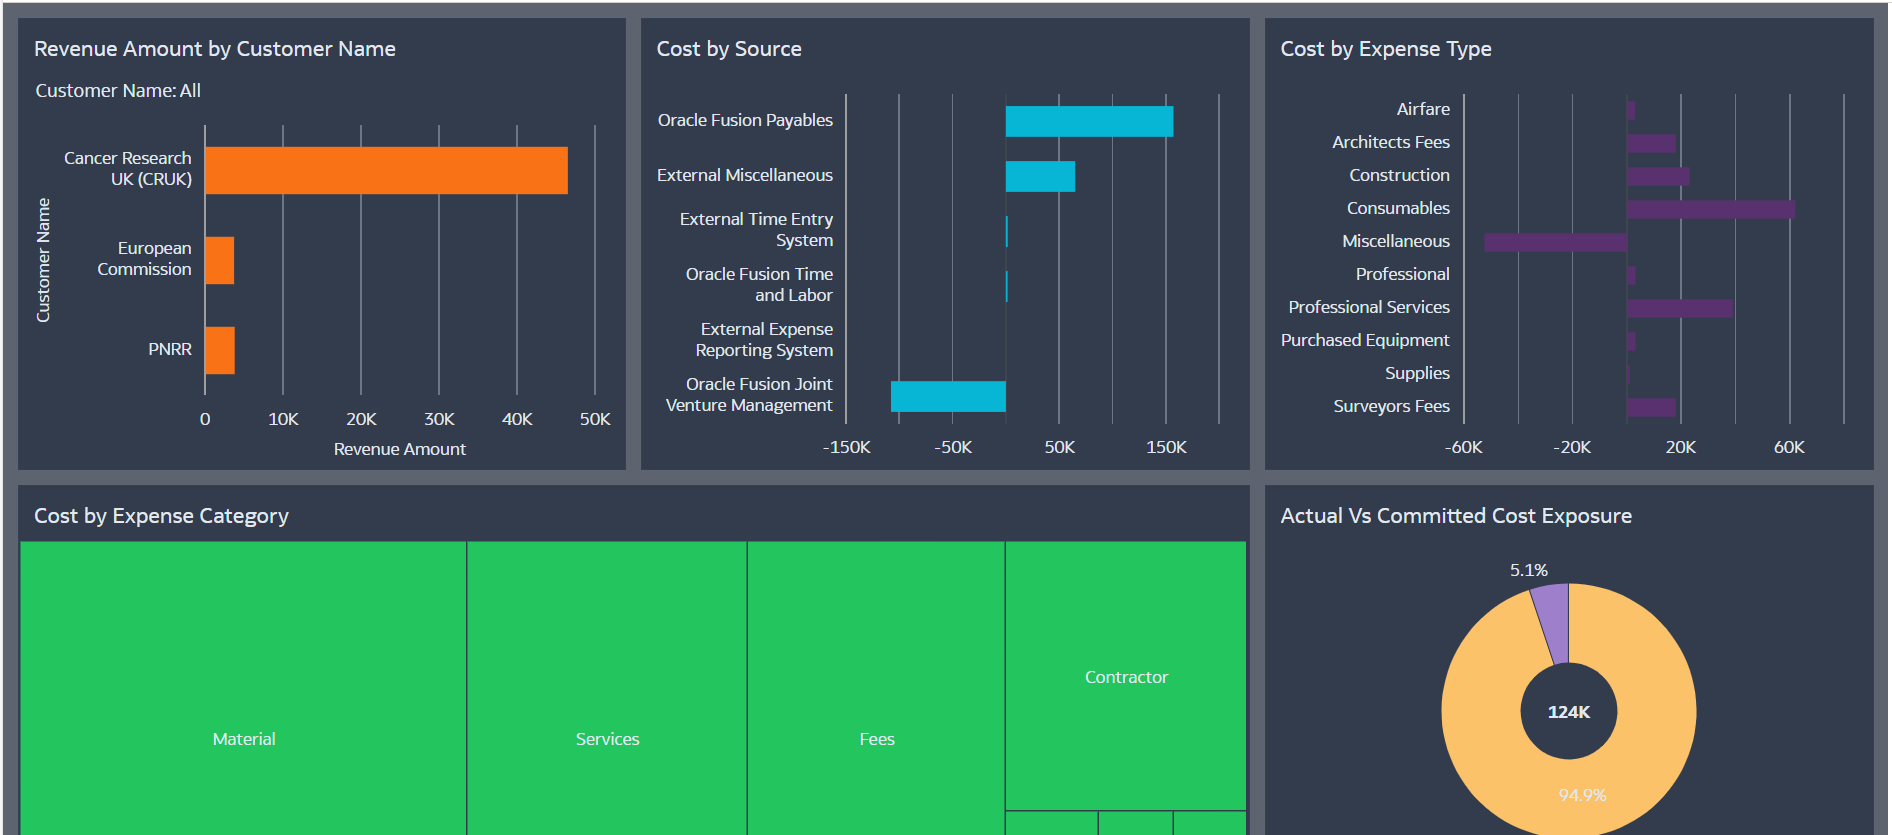
- Revenue distribution by customer
- Cost breakdown by transaction source
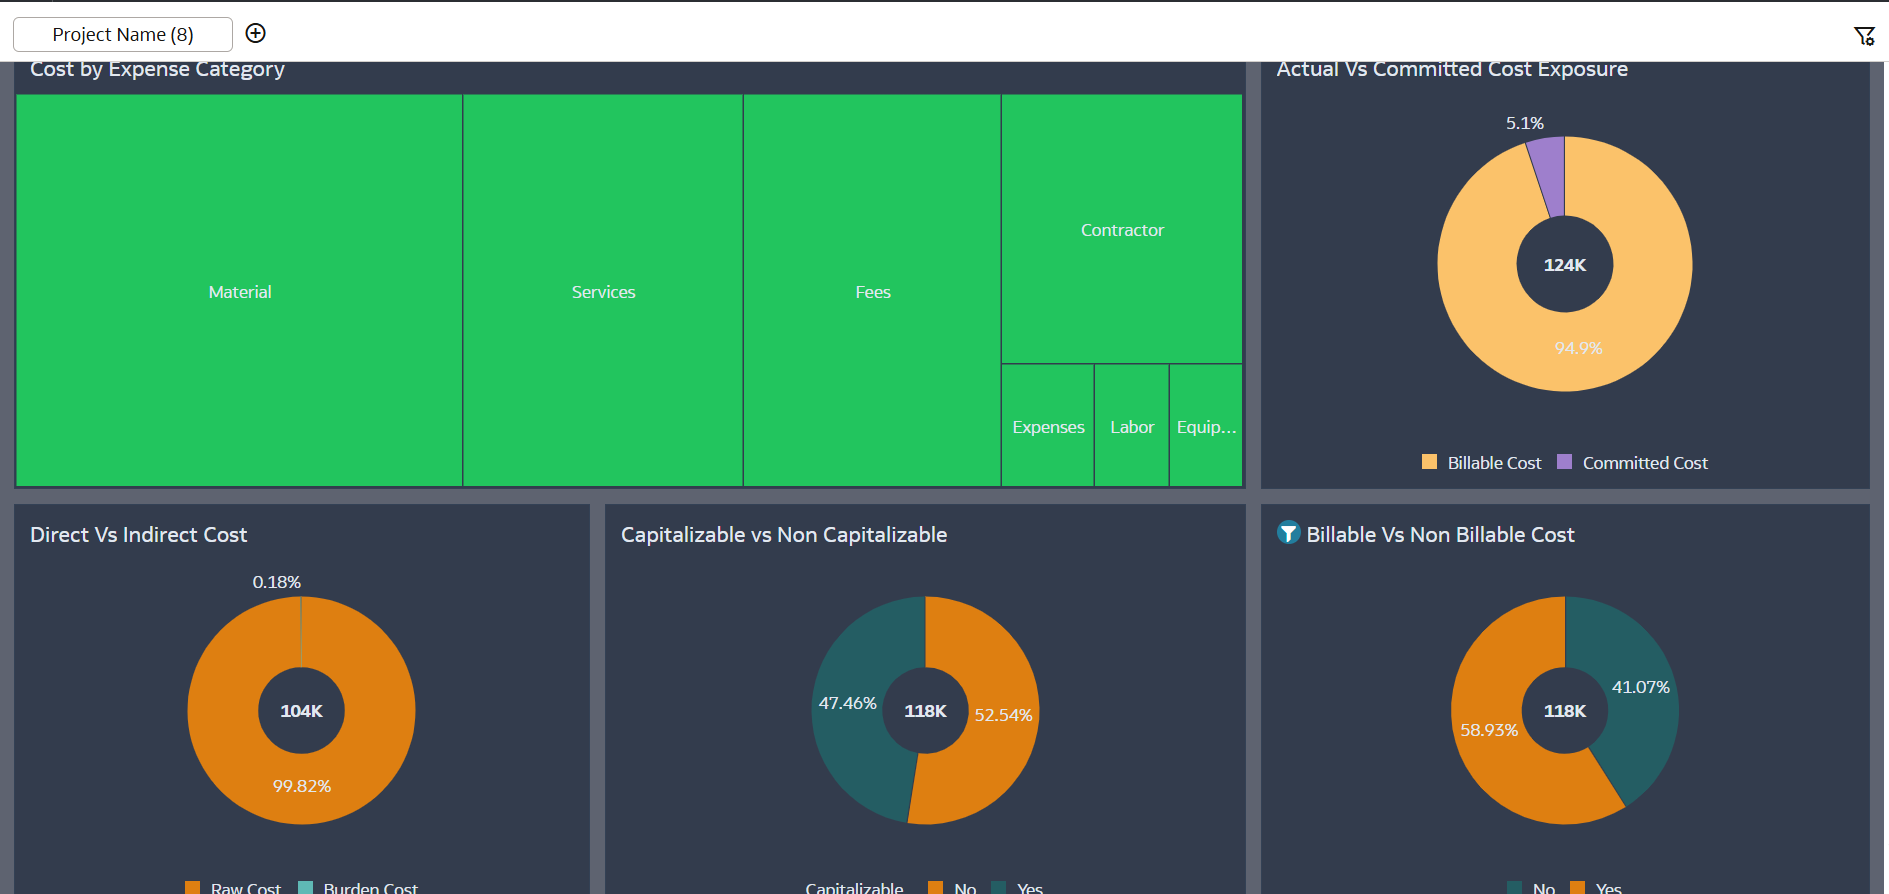
- Cost distribution by expenditure category and type
- Direct vs indirect cost structure
- Billable vs non-billable cost analysis
- Capitalizable vs non-capitalizable cost distribution
- Actual vs committed cost comparison
Together, these views provide a comprehensive picture of project financial performance.
6. Use of Oracle Analytics AI Features
OAC AI Insights was used during the data exploration phase.
AI Insights helped identify patterns in financial distributions and suggested alternative visualizations that better highlight project profitability trends and cost structures.
7. Relationship with the Portfolio Dashboard
This dashboard complements the previously published Project Portfolio Profitability Insights Dashboard.
The two dashboards serve different analytical purposes:
Dashboard | Purpose |
|---|
Portfolio Profitability Insights | Identify which projects and organizations drive portfolio performance |
Project Profitability Insights | Diagnose the financial drivers of an individual project's profitability |
This layered approach allows organizations to move from portfolio monitoring to detailed project diagnostics.
8. Value of This Approach
By combining portfolio-level monitoring with project-level analysis, organizations can:
- Quickly identify projects requiring attention
- Understand profitability drivers at a deeper level
- Monitor cost structure and revenue contribution
- Improve financial governance across project portfolios