1. Which dataset did you use?
I used a comprehensive Uber dataset containing ride-level details such as bookings, cancellations, revenue, distance, ride type (Auto, Bike, Sedan, Go Mini, Premier), timestamps (Month & Quarter), customer and driver ratings, and cancellation reasons. This dataset enabled multi-dimensional analysis across ride performance, revenue trends, and operational efficiency.
2. How did you analyze or prepare the data?
I performed data preparation and transformation within Oracle Analytics Cloud by:
Standardizing measures like Revenue, Distance, Ratings, and Booking Counts into numeric formats
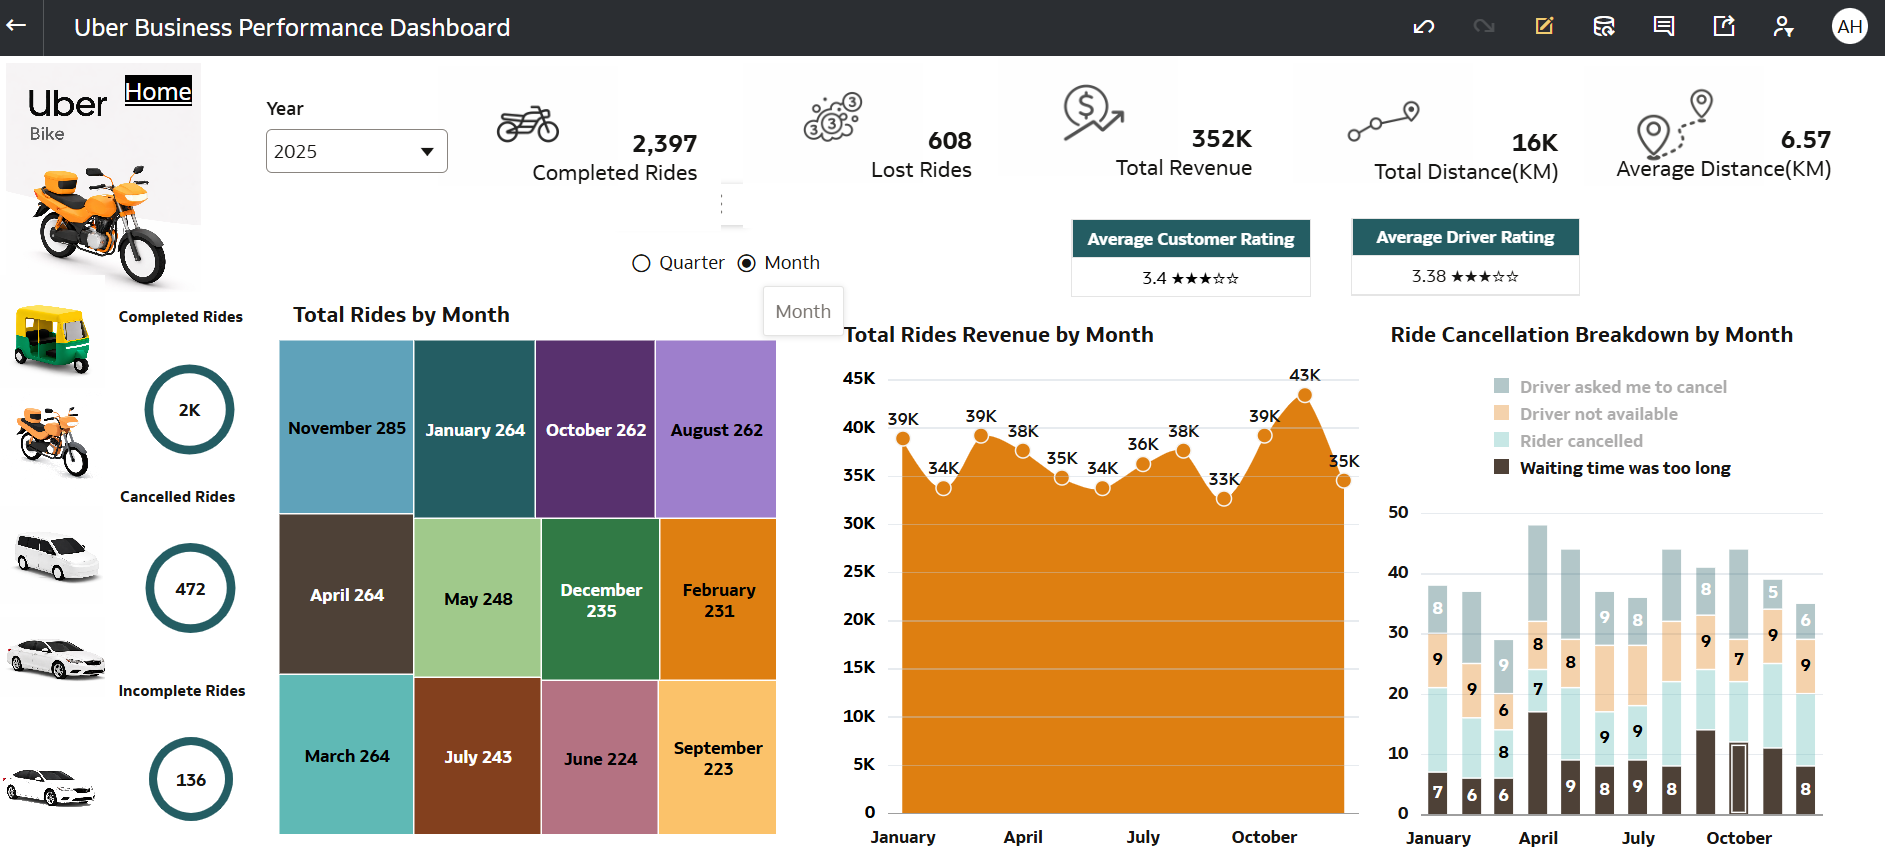
Creating calculated KPIs such as:
Completed Bookings
Lost Bookings
Total Revenue
Average Distance
Customer & Driver Ratings
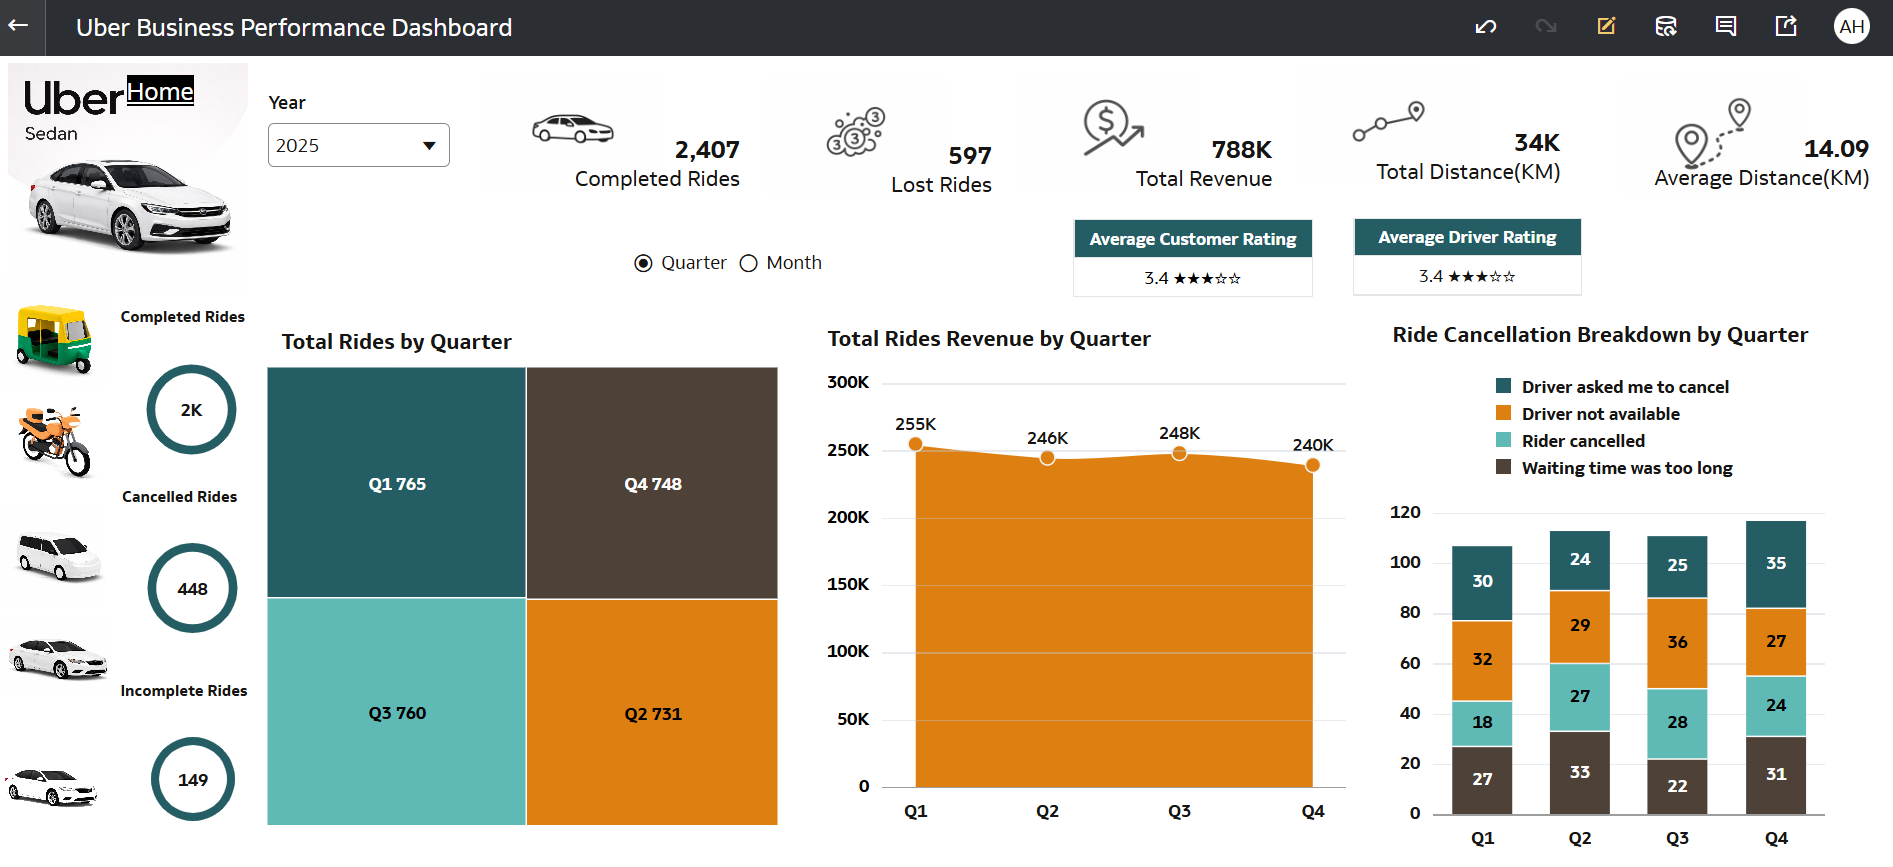
Implementing parameters to dynamically switch views between Month and Quarter analysis
Designing drill-down functionality using vehicle icons (Auto, Bike, Sedan, Go Mini, Premier) for intuitive navigation
Structuring data to support trend analysis (Q1–Q4) and cancellation breakdown insights
Applying filters (Year selection) to make the dashboard interactive and dynamic
3. Who is the intended audience for your visualization?
This dashboard is designed for:
Operations Managers → to monitor ride performance and efficiency
Business Analysts → to analyze trends in bookings, revenue, and cancellations
City/Regional Heads → to track performance across time and ride types
Decision-Makers → to optimize pricing, driver allocation, and customer experience
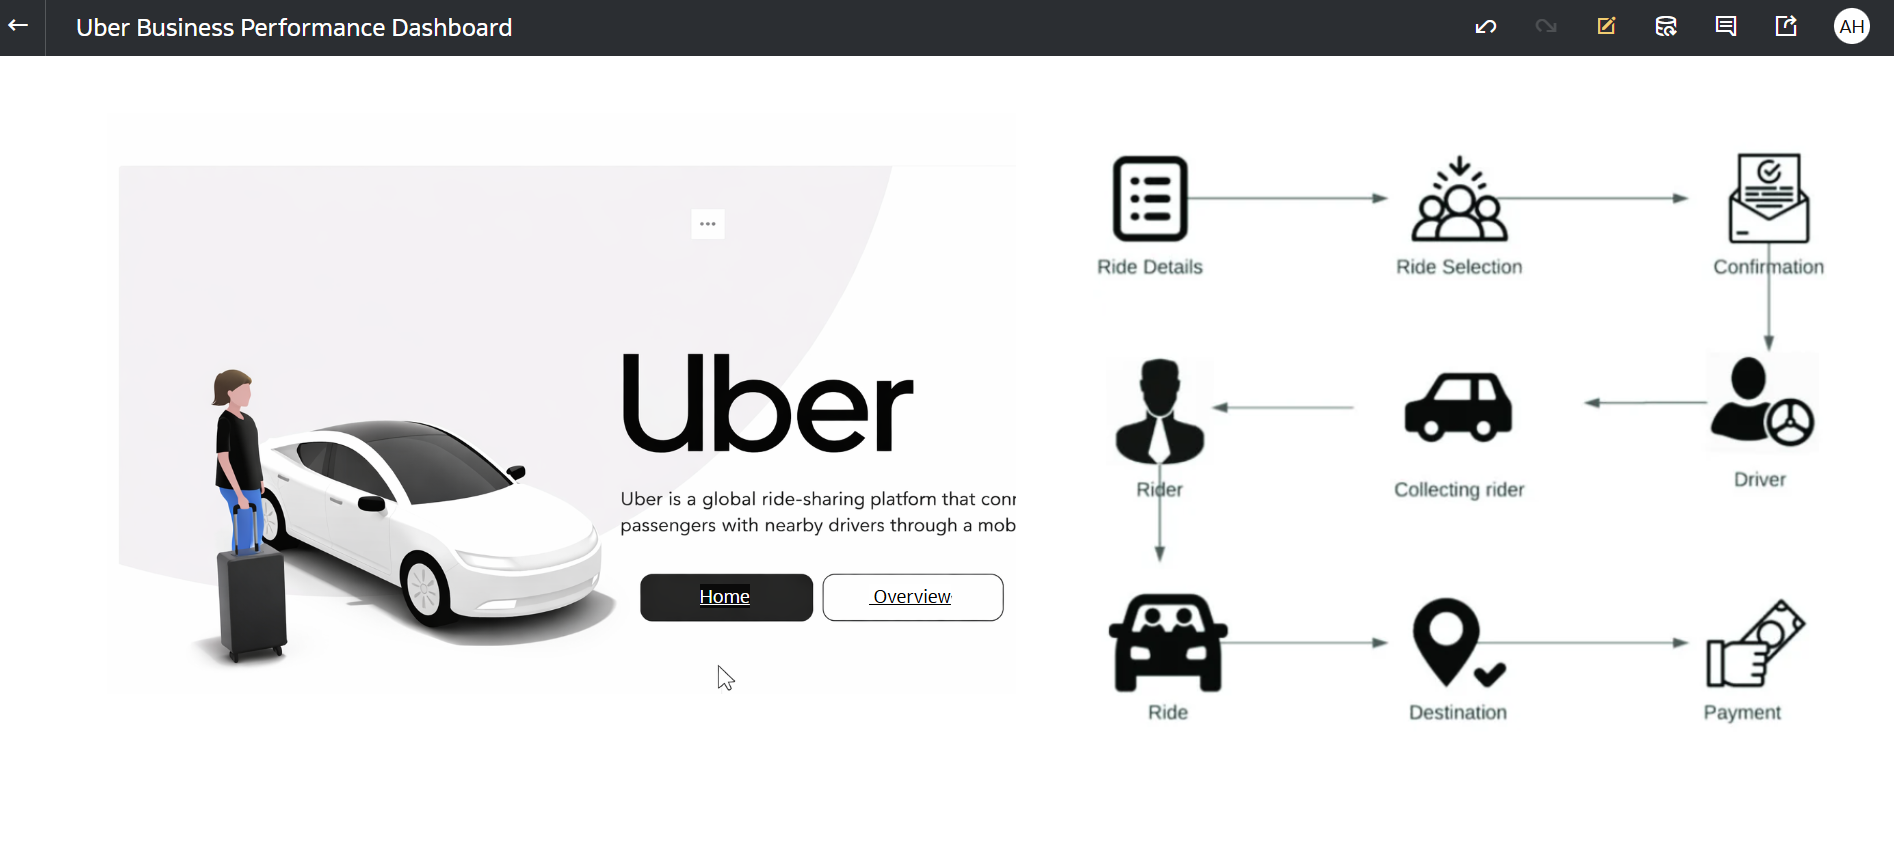
4. What is your visualization about, and what question or problem does it address?
This dashboard provides a complete analytical view of Uber ride operations, focusing on bookings, revenue, cancellations, and customer experience.
It addresses the key business questions:
- “How are ride bookings, revenue, and cancellations trending over time?”
- “Which ride types and periods perform best or worst?”
- “What are the main reasons for ride cancellations?”
By integrating KPIs, trend analysis, and cancellation breakdowns, the dashboard helps:
Identify high and low-performing quarters/months
Understand revenue fluctuations
Detect customer behavior patterns
Analyze cancellation reasons (driver issues, wait time, etc.)
Enable data-driven operational improvements
5. Did you use any Oracle Analytics AI features? If so, how?
Yes, I used Oracle Analytics AI features to enhance insights:
Generated AI-driven insights on revenue trends and booking patterns
Identified anomalies and key drivers behind lost bookings and cancellations
Used AI suggestions to highlight performance variations across quarters
Refined insights to focus on customer experience and operational efficiency
These AI capabilities helped transform raw data into actionable insights.
6. Did you upload your visualization image and DVA file?
Yes, the dashboard image and DVA file have been successfully uploaded.


