1. Which dataset did you use?
The dataset which is synthetic and represents the simulation of real-world service operations of a Car Service network running across 7 service centers in Chennai. It captures 23 months of day-to-day service activity, from the first customer walk-in to the final invoice — tracking every repair job, periodic maintenance visit, spare part consumed, and technician assigned along the way.
2. How did you analyze or prepare the data?
The dataset was uploaded directly into Oracle Analytics Cloud as a self-service dataset and all preparation was done natively within OAC.
- Data profiling — Used OAC's built-in data profiling to inspect column distributions, check for nulls, and validate data types across all columns before building any visuals. Used custom GeoJson file to map the local regions.
- Calculated columns — Created enriched columns within OAC's data preparation editor including Service Month (extracted from Service Date for time-series analysis), Service Time Bin (on-time vs overdue by comparing Expected vs Actual Completion Date).
- Calculated measures — Defined key business metrics directly in OAC including Services Completed or Pending, Technician Efficiency Rate, Period-over-Period Revenue Change, and Center-wise Pending Rate.
- Forecasting — Applied OAC's native time-series forecast on monthly revenue with a 95% prediction interval to project the next 3 months of revenue trend
- Filters & parameters — Configured interactive dashboard filters for Model, Fuel Type, Service center location, Service Date, Invoice Status, and Technician ID — enabling the audience to slice the data.
3. Who is the intended audience?
- Primary: Service network operations managers overseeing multiple Chennai centers — focused on revenue, capacity, and center-level performance
- Secondary: Individual service center managers — focused on technician productivity, spare parts demand, and customer satisfaction at their location
4. What is your visualization about, and what question does it address?
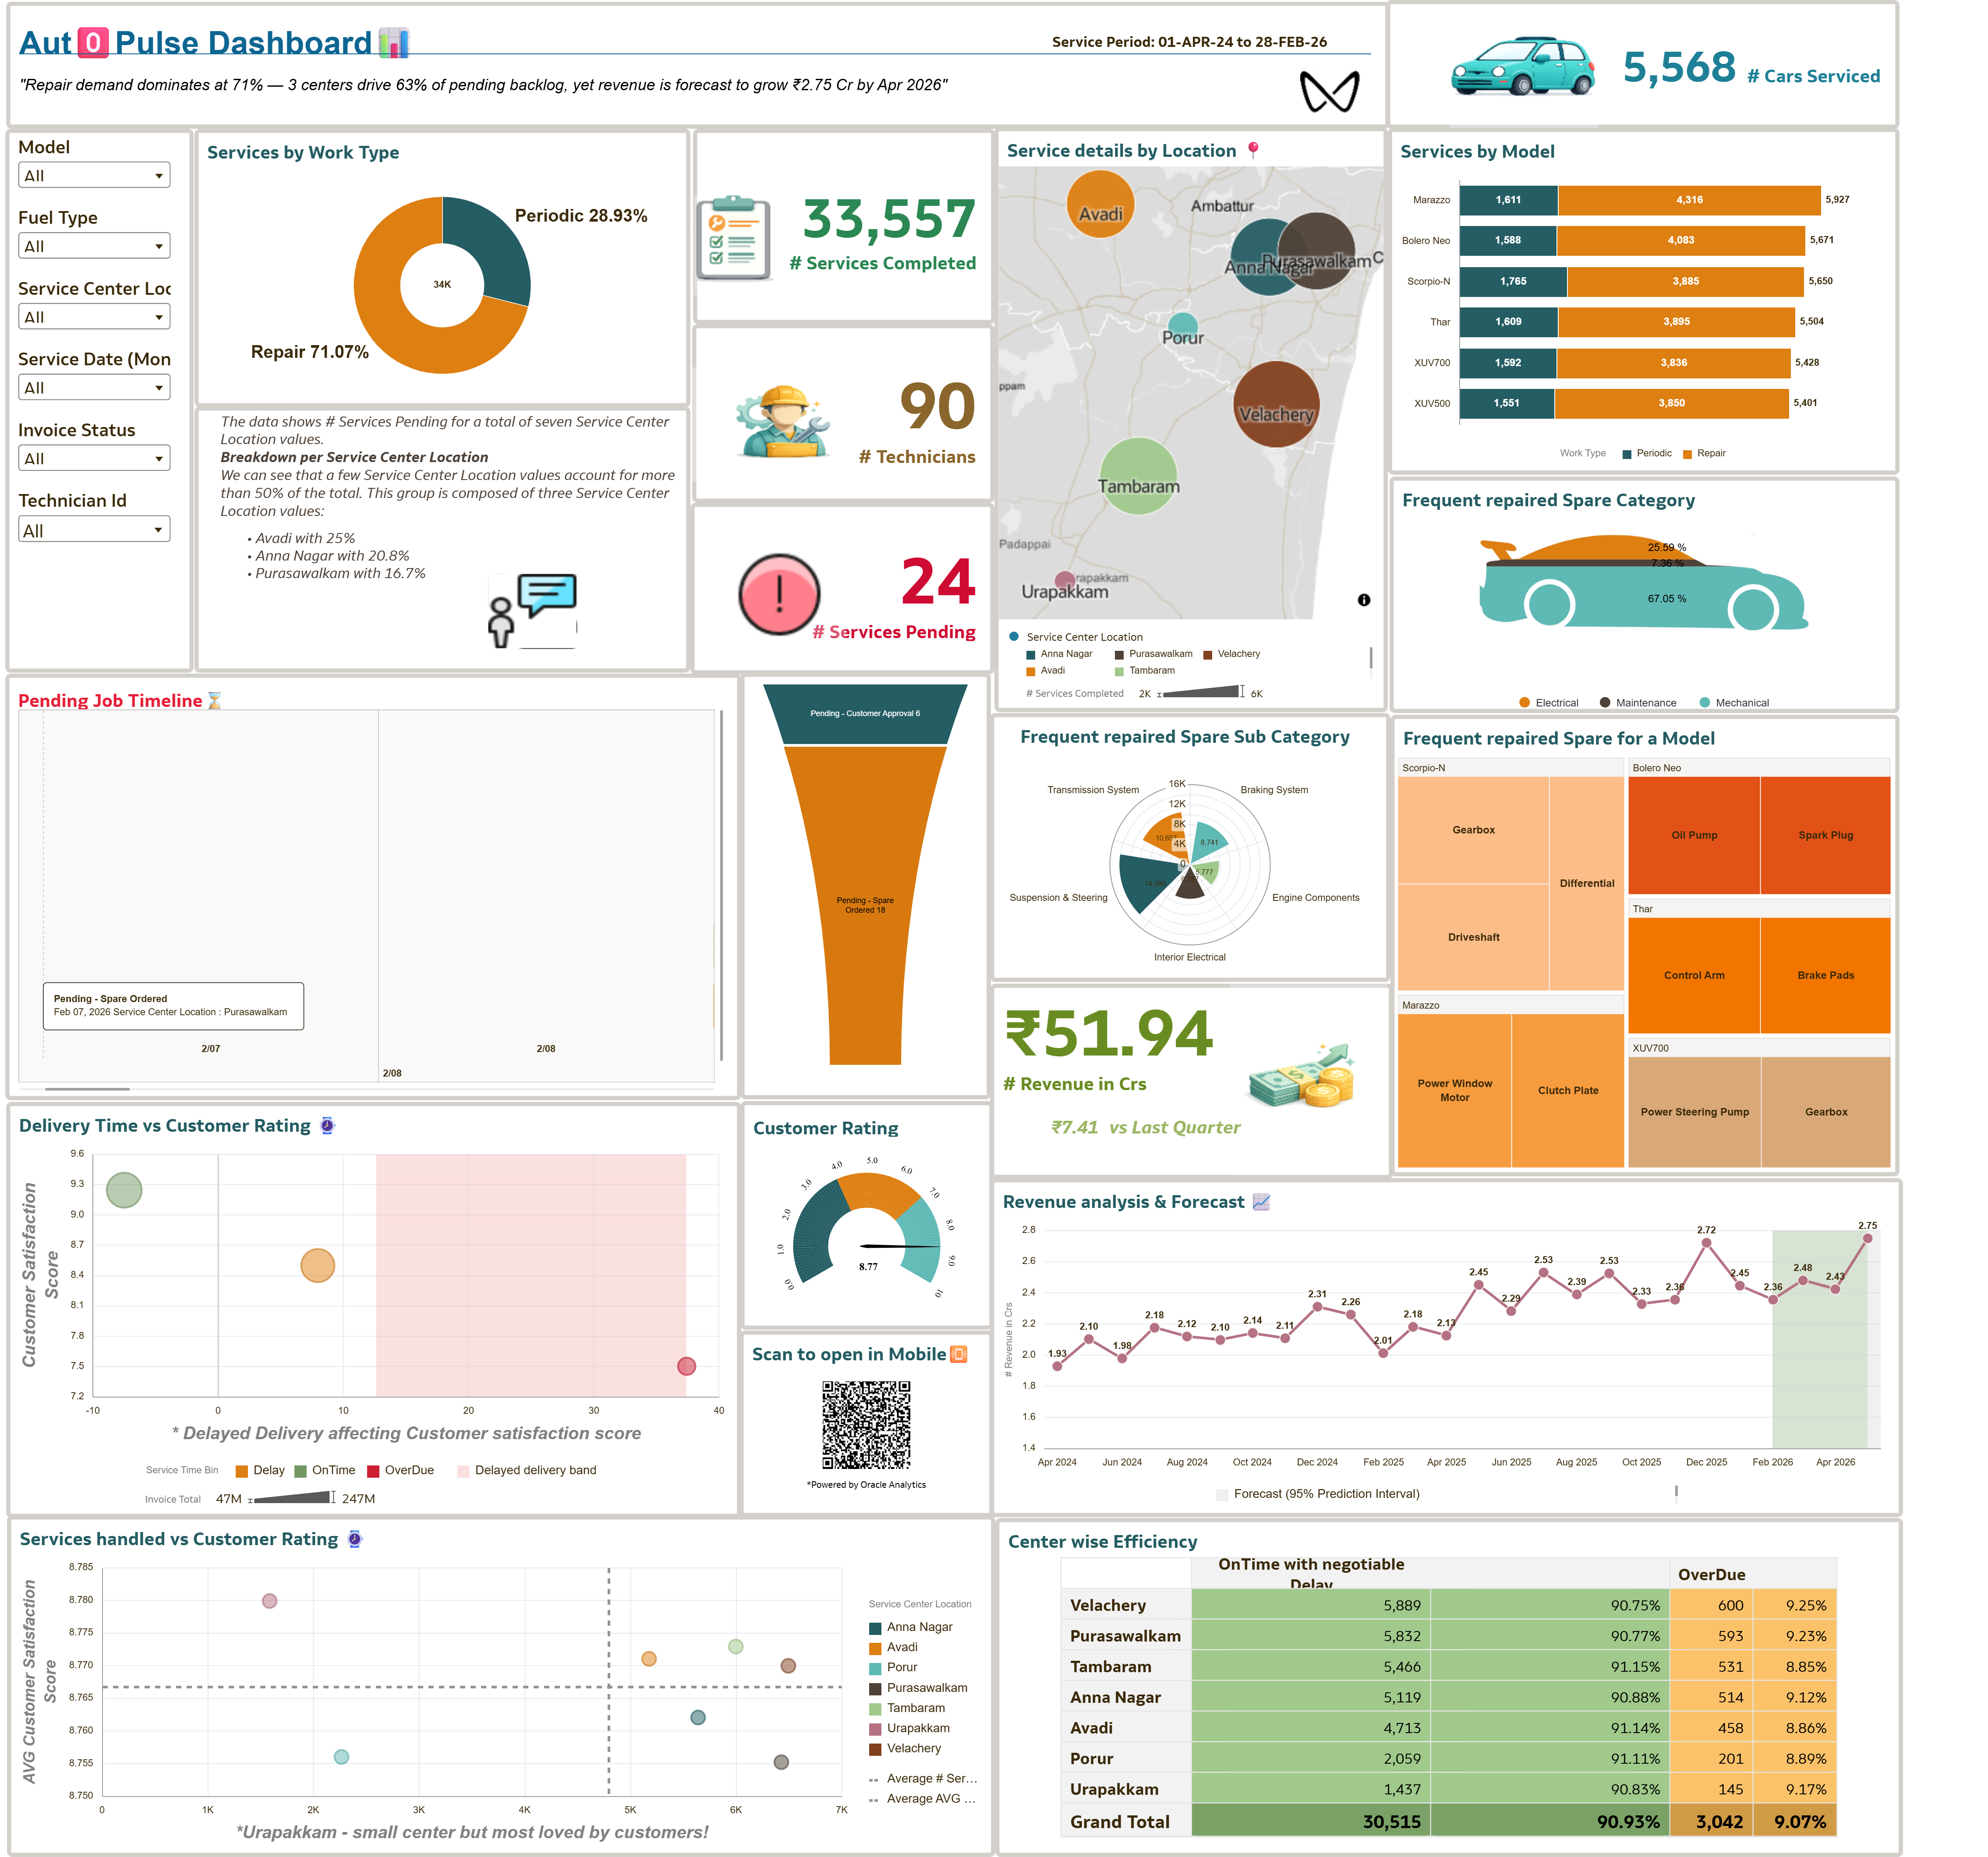
Central question: Across 7 Chennai service centers — where are the bottlenecks, who drives the most value, and is revenue on track?
AutoPulse addresses three interconnected operational problems:
- Demand mix — Repair jobs dominate at 71%, creating uneven workload distribution; understanding this split helps in technician allocation and capacity planning
- Pending backlog — 3 centers (Avadi 25%, Anna Nagar 20.8%, Purasawalkam 16.7%) account for 63% of all pending jobs, signaling where intervention is needed most
- Performance & growth — Urapakkam, the smallest center, consistently leads in customer satisfaction; total revenue is ₹51.94 Cr (+₹7.41 Cr vs last quarter) with forecast growth projected to ₹2.75 Cr by April 2026
5. Did you use any Oracle Analytics AI features when building your visualization (ex. AI Assistant)? If so, please describe how they were used
Yes, a conversational AI Agent designed for a Delivery Manager persona, enabling them to interact directly with the Car Service operations data using plain natural language — no SQL, no filters, no dashboard navigation required.
How it works:
The agent connects to the underlying service dataset and allows a Delivery Manager to ask questions like:
- "Which service center has the most pending jobs this month?"
- "What is the revenue trend for Velachery over the last 6 months?"
- "Which spare parts are causing the most delays in job completion?"
The agent interprets the intent, queries the data, and responds in plain language or quick visualizations with the relevant numbers and insights — making data accessible to operational managers who may not be comfortable navigating a BI dashboard.
6. Attaching a short video and dva file here.
