OTT Platform Analytics
This dashboard provides an integrated analytical view of OTT content performance by combining content attributes like genre, language, ratings, and viewership into a single decision-support framework.
It connects audience engagement metrics with content characteristics to identify trends, preferences, and high-performing categories across platforms.
1.Which dataset did you use?
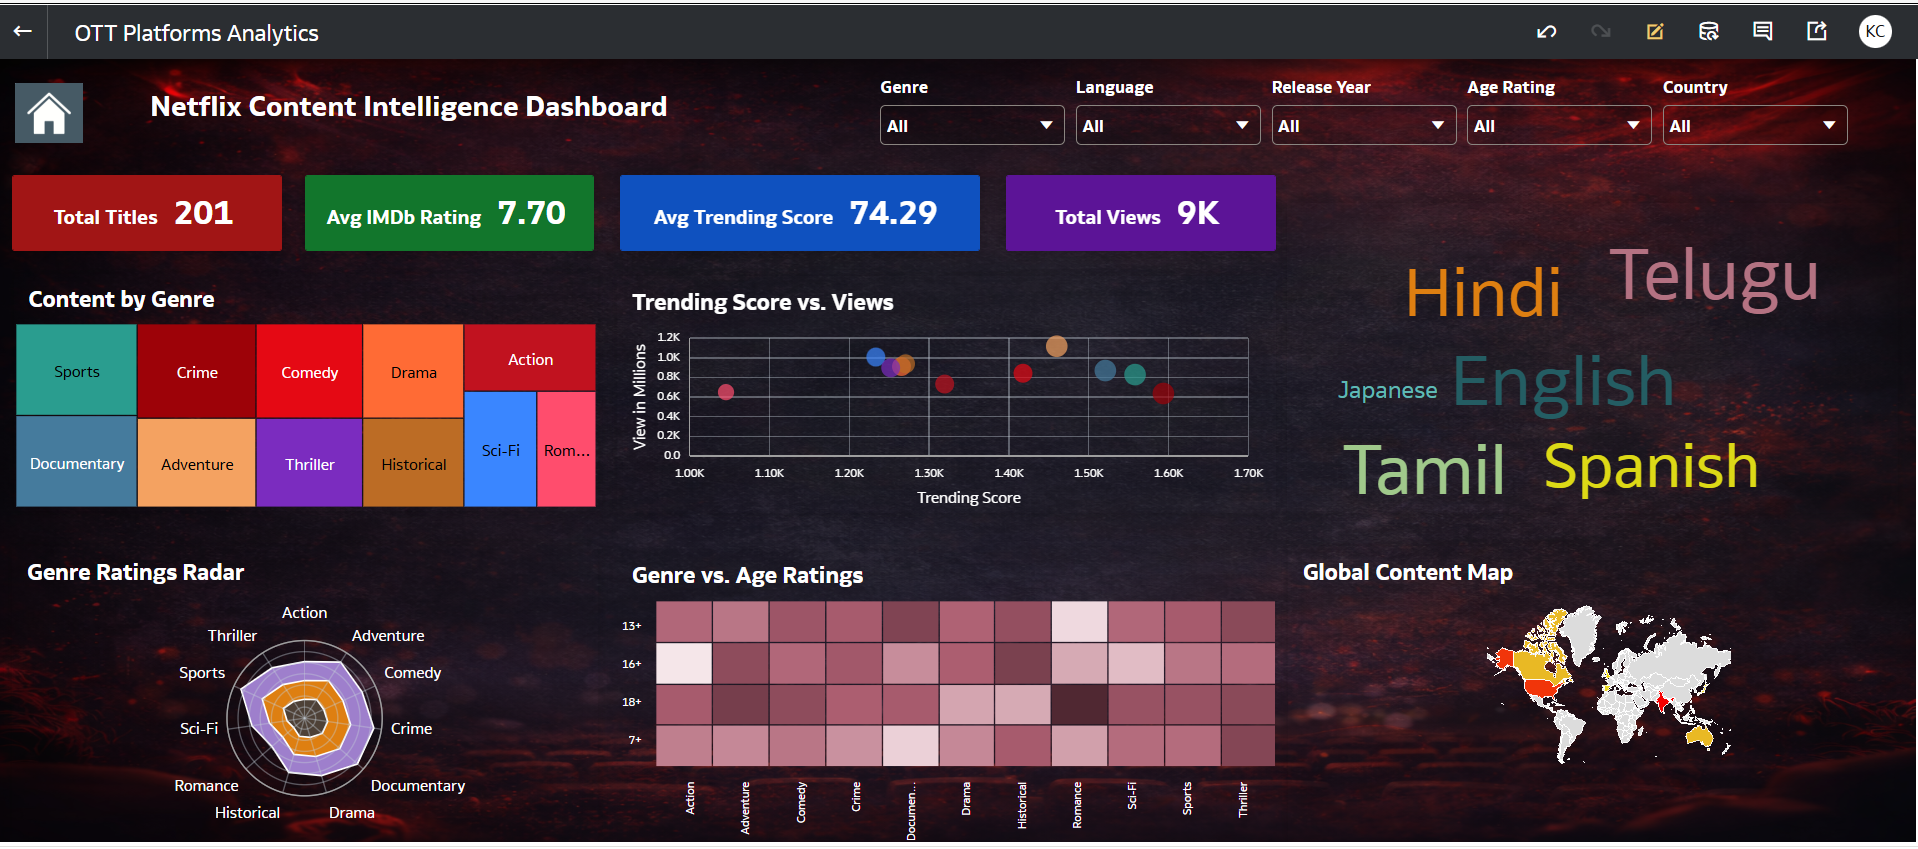
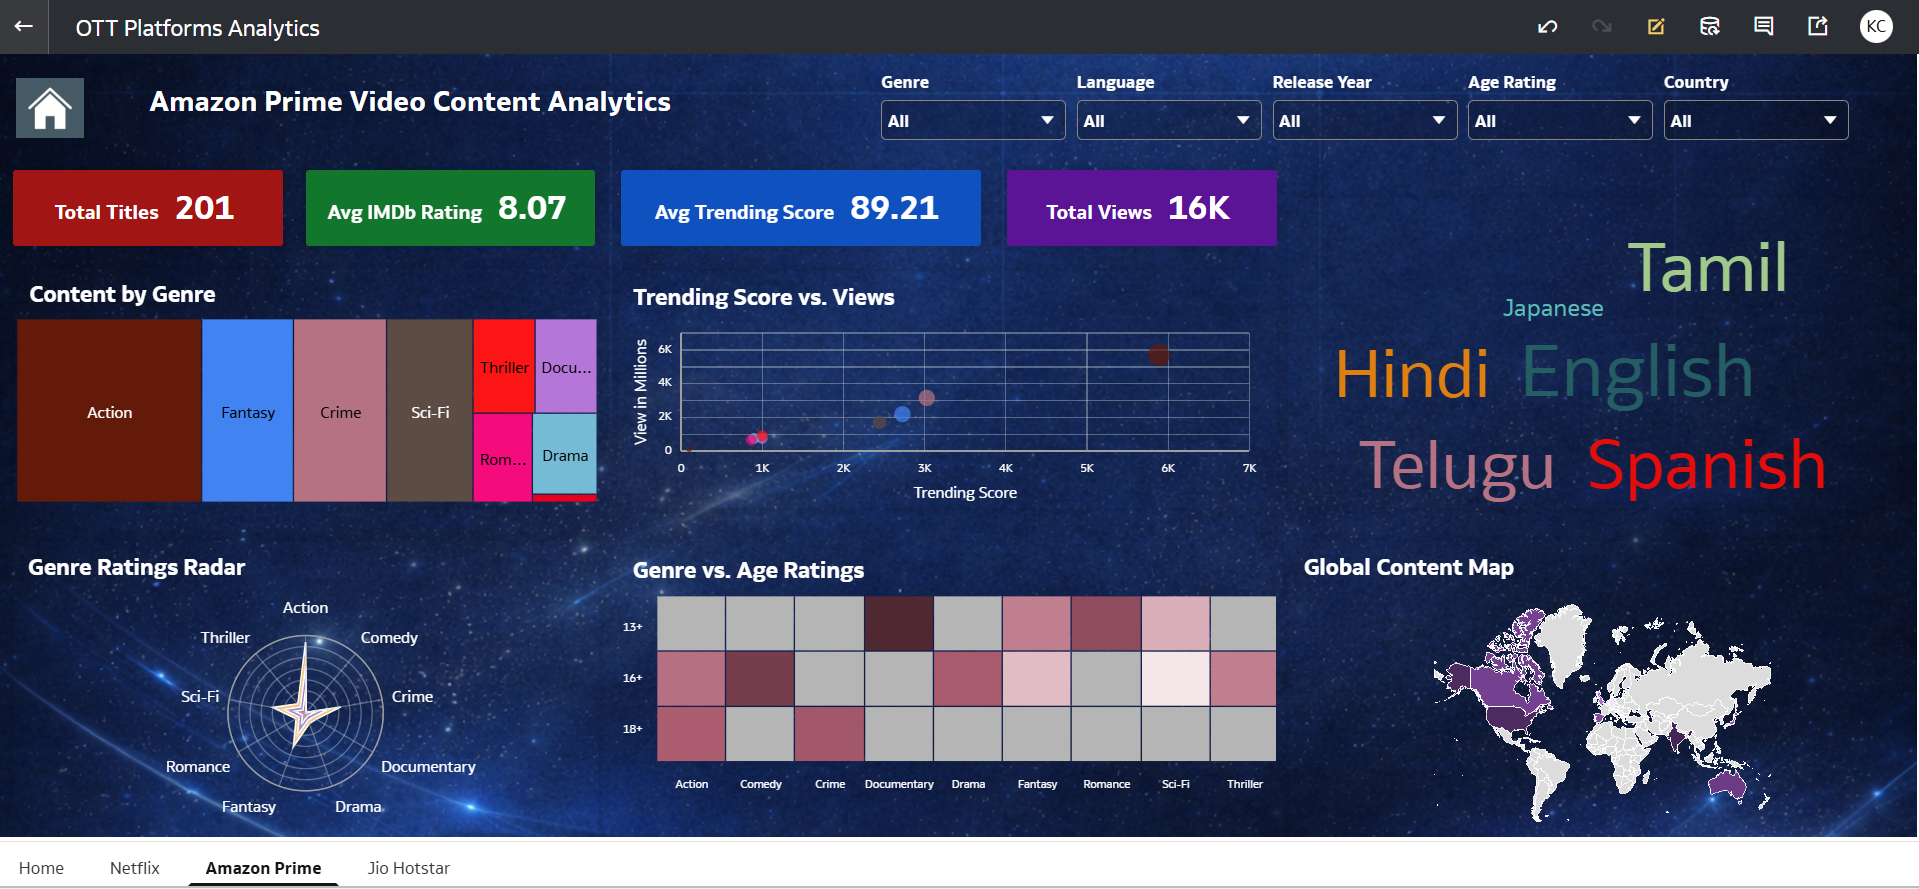
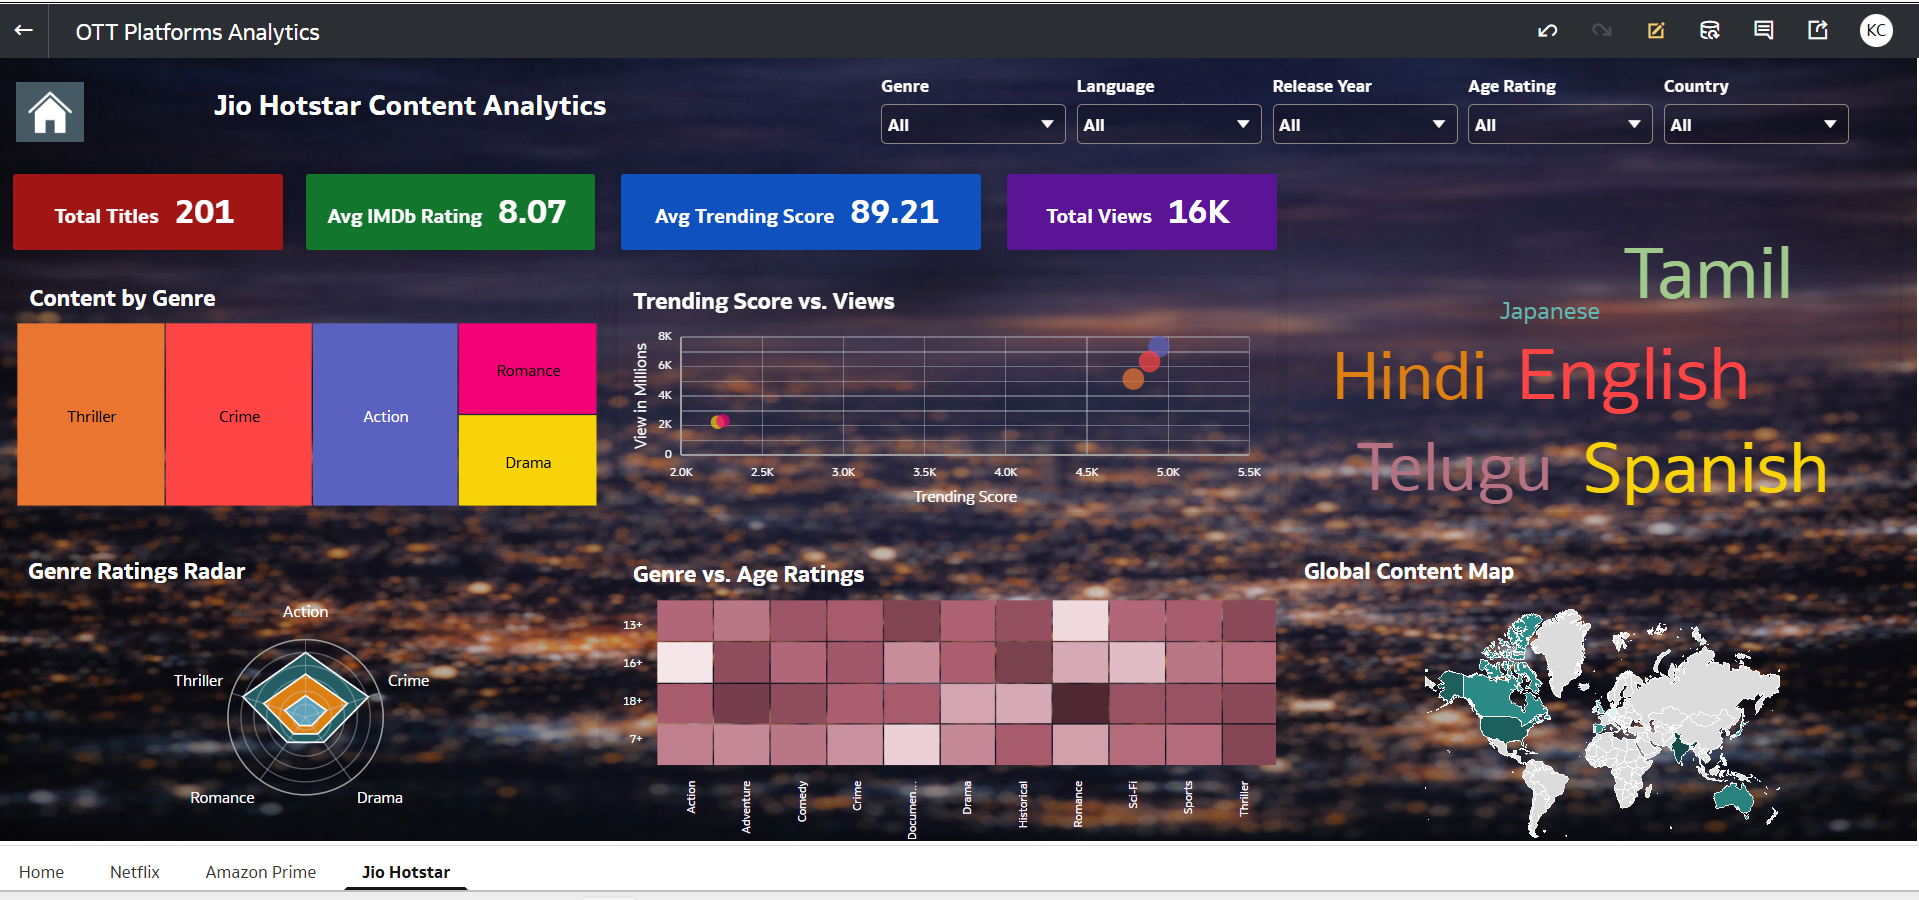
I used individual datasets for Netflix, Amazon Prime, and JioHotstar containing content attributes like genre, language, IMDb rating, views, release year, and age rating, organized within a single Oracle Analytics Cloud workbook.
2.How did you analyze or prepare the data?
I standardized key attributes such as genre, language, and age ratings and ensured all measures like views, ratings, and scores were in numeric formats. I created calculated KPIs such as Avg IMDb Rating, Trending Score, and Total Views directly in OAC. Filters and visual interactions were applied to enable dynamic cross-platform and multi-dimensional analysis.
3.Who is the intended audience for your visualization?
The dashboard is designed for OTT platform managers, content strategists, marketing teams, and business decision-makers. It provides insights into content performance, audience preferences, and regional trends. It also supports analysts in identifying patterns across genres, languages, and engagement metrics.
4.What is your visualization about, and what question or problem does it address?
The visualization provides a comprehensive view of OTT content performance across multiple platforms. It addresses the key business question:
“What type of content drives higher engagement and audience reach across OTT platforms?”
By analyzing genre distribution, ratings, views, and regional preferences, the dashboard helps identify trending content, optimize content strategy, and improve audience targeting.
5.Did you use any Oracle Analytics AI features when building your visualization (ex. AI Assistant)? If so, please describe how they were used?
Yes, I have leveraged the AI capabilities within Oracle Analytics to derive insights and references, enabling the creation of more meaningful, insightful, and visually impactful dashboard visualizations.
6.Did you upload your visualization image and DVA file?
Yes, completed successfully.
