Answers to the questions
- Which dataset did you use?
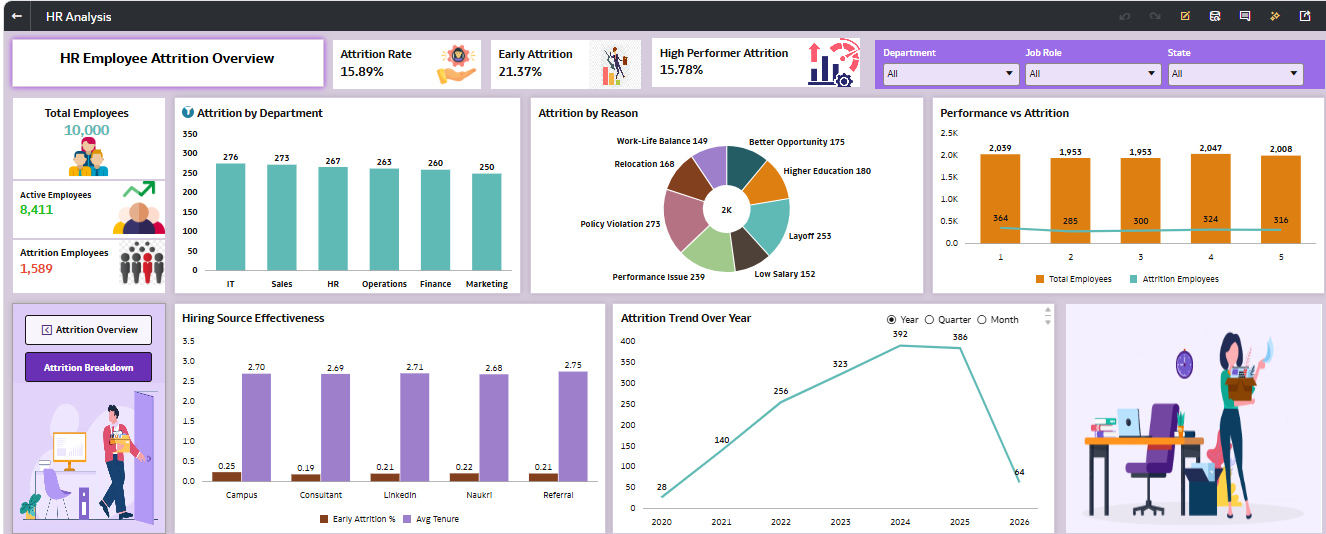
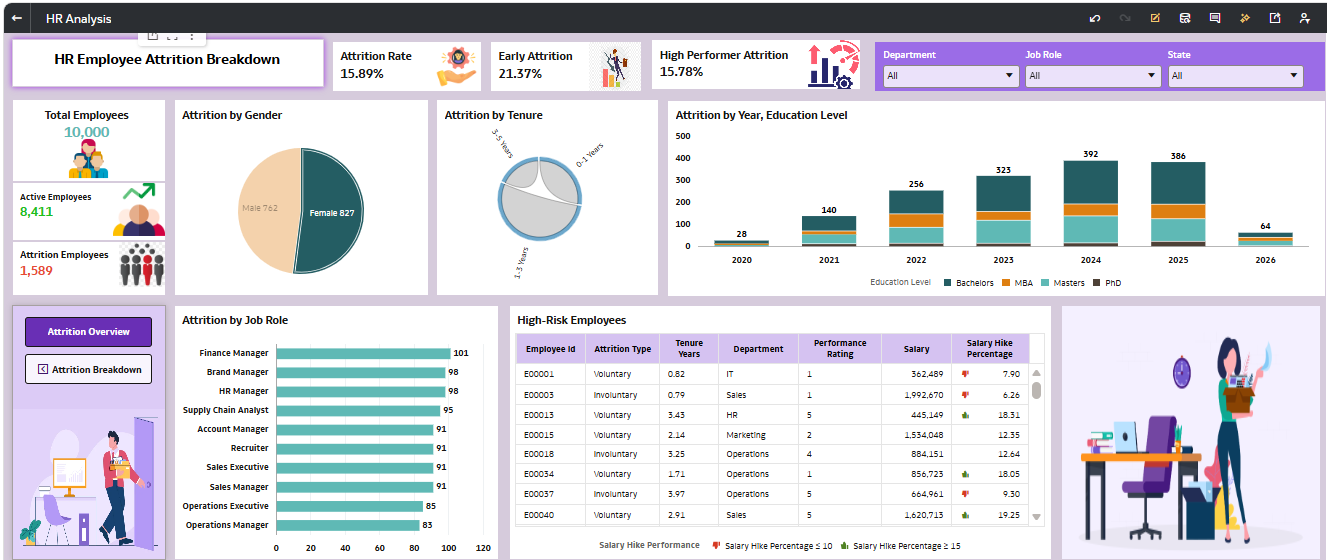
I used a synthetic HR dataset designed to simulate real-world employee data. It includes attributes such as employee demographics, job roles, performance ratings, salary, tenure, hiring sources, and attrition details. The dataset was further enhanced with business-relevant fields like attrition reasons and performance metrics to support deeper analysis.
- How did you analyze or prepare the data?
Data preparation was carried out using Oracle Analytics. Key steps included:
- Cleaning and standardizing fields (e.g., department names, tenure)
- Creating calculated metrics such as:
- Attrition Rate
- Early Attrition (tenure < 2 years)
- High Performer Attrition
- Deriving time-based attributes from hire date (e.g., year)
- Grouping tenure into meaningful categories
- Validating measures to avoid aggregation inconsistencies
3. Who is the intended audience?
The dashboard is designed for:
- HR Managers
- Business Leaders
- Talent Acquisition Teams
It enables data-driven decision-making related to workforce planning, retention strategies, and hiring effectiveness.
4. What is your visualization about, and what problem does it address?
The visualization focuses on employee attrition analysis and aims to address key business questions such as:
- Why are employees leaving?
- Which departments or roles are most impacted?
- Are high-performing employees being lost?
- Is attrition trending upward over time?
- Which hiring sources result in better employee retention?
The primary objective is to reduce attrition, improve retention, and optimize hiring strategies.
5. Did you use Oracle Analytics AI features?
Yes, I utilized Oracle Analytics AI capabilities, including:
- Explain, to identify key drivers of attrition
- Auto Insights and AI Assistant for generating insights, which were further refined and customized
6. Did you upload your visualization image and DVA file?
Yes, I exported and saved:
- Dashboard images for presentation purposes
- The DVA project file for reuse and demonstration