1.Which dataset did you use?
Synthetic RetailIQ data generated using chatbot
2.How did you analyze or prepare the data?
Explain : I right-clicked on key measures such as Sales and Profit to run the Explain feature. This automatically surfaced the key drivers, outliers, and segments contributing most to performance, which helped me decide which dimensions to focus on in my visualizations.
Auto-Insights : I ran Auto-Insights on the dataset to get an instant overview of patterns and anomalies across the data.
AI Assistant : I asked the AI Assistant natural language questions such as "Which cities have the highest sales?" and "Show me sales by state on a map." The AI Assistant generated visualizations in response, and I incorporated one of the map visualizations it produced directly into my dashboard.
3. Who is the intended audience for your visualization?
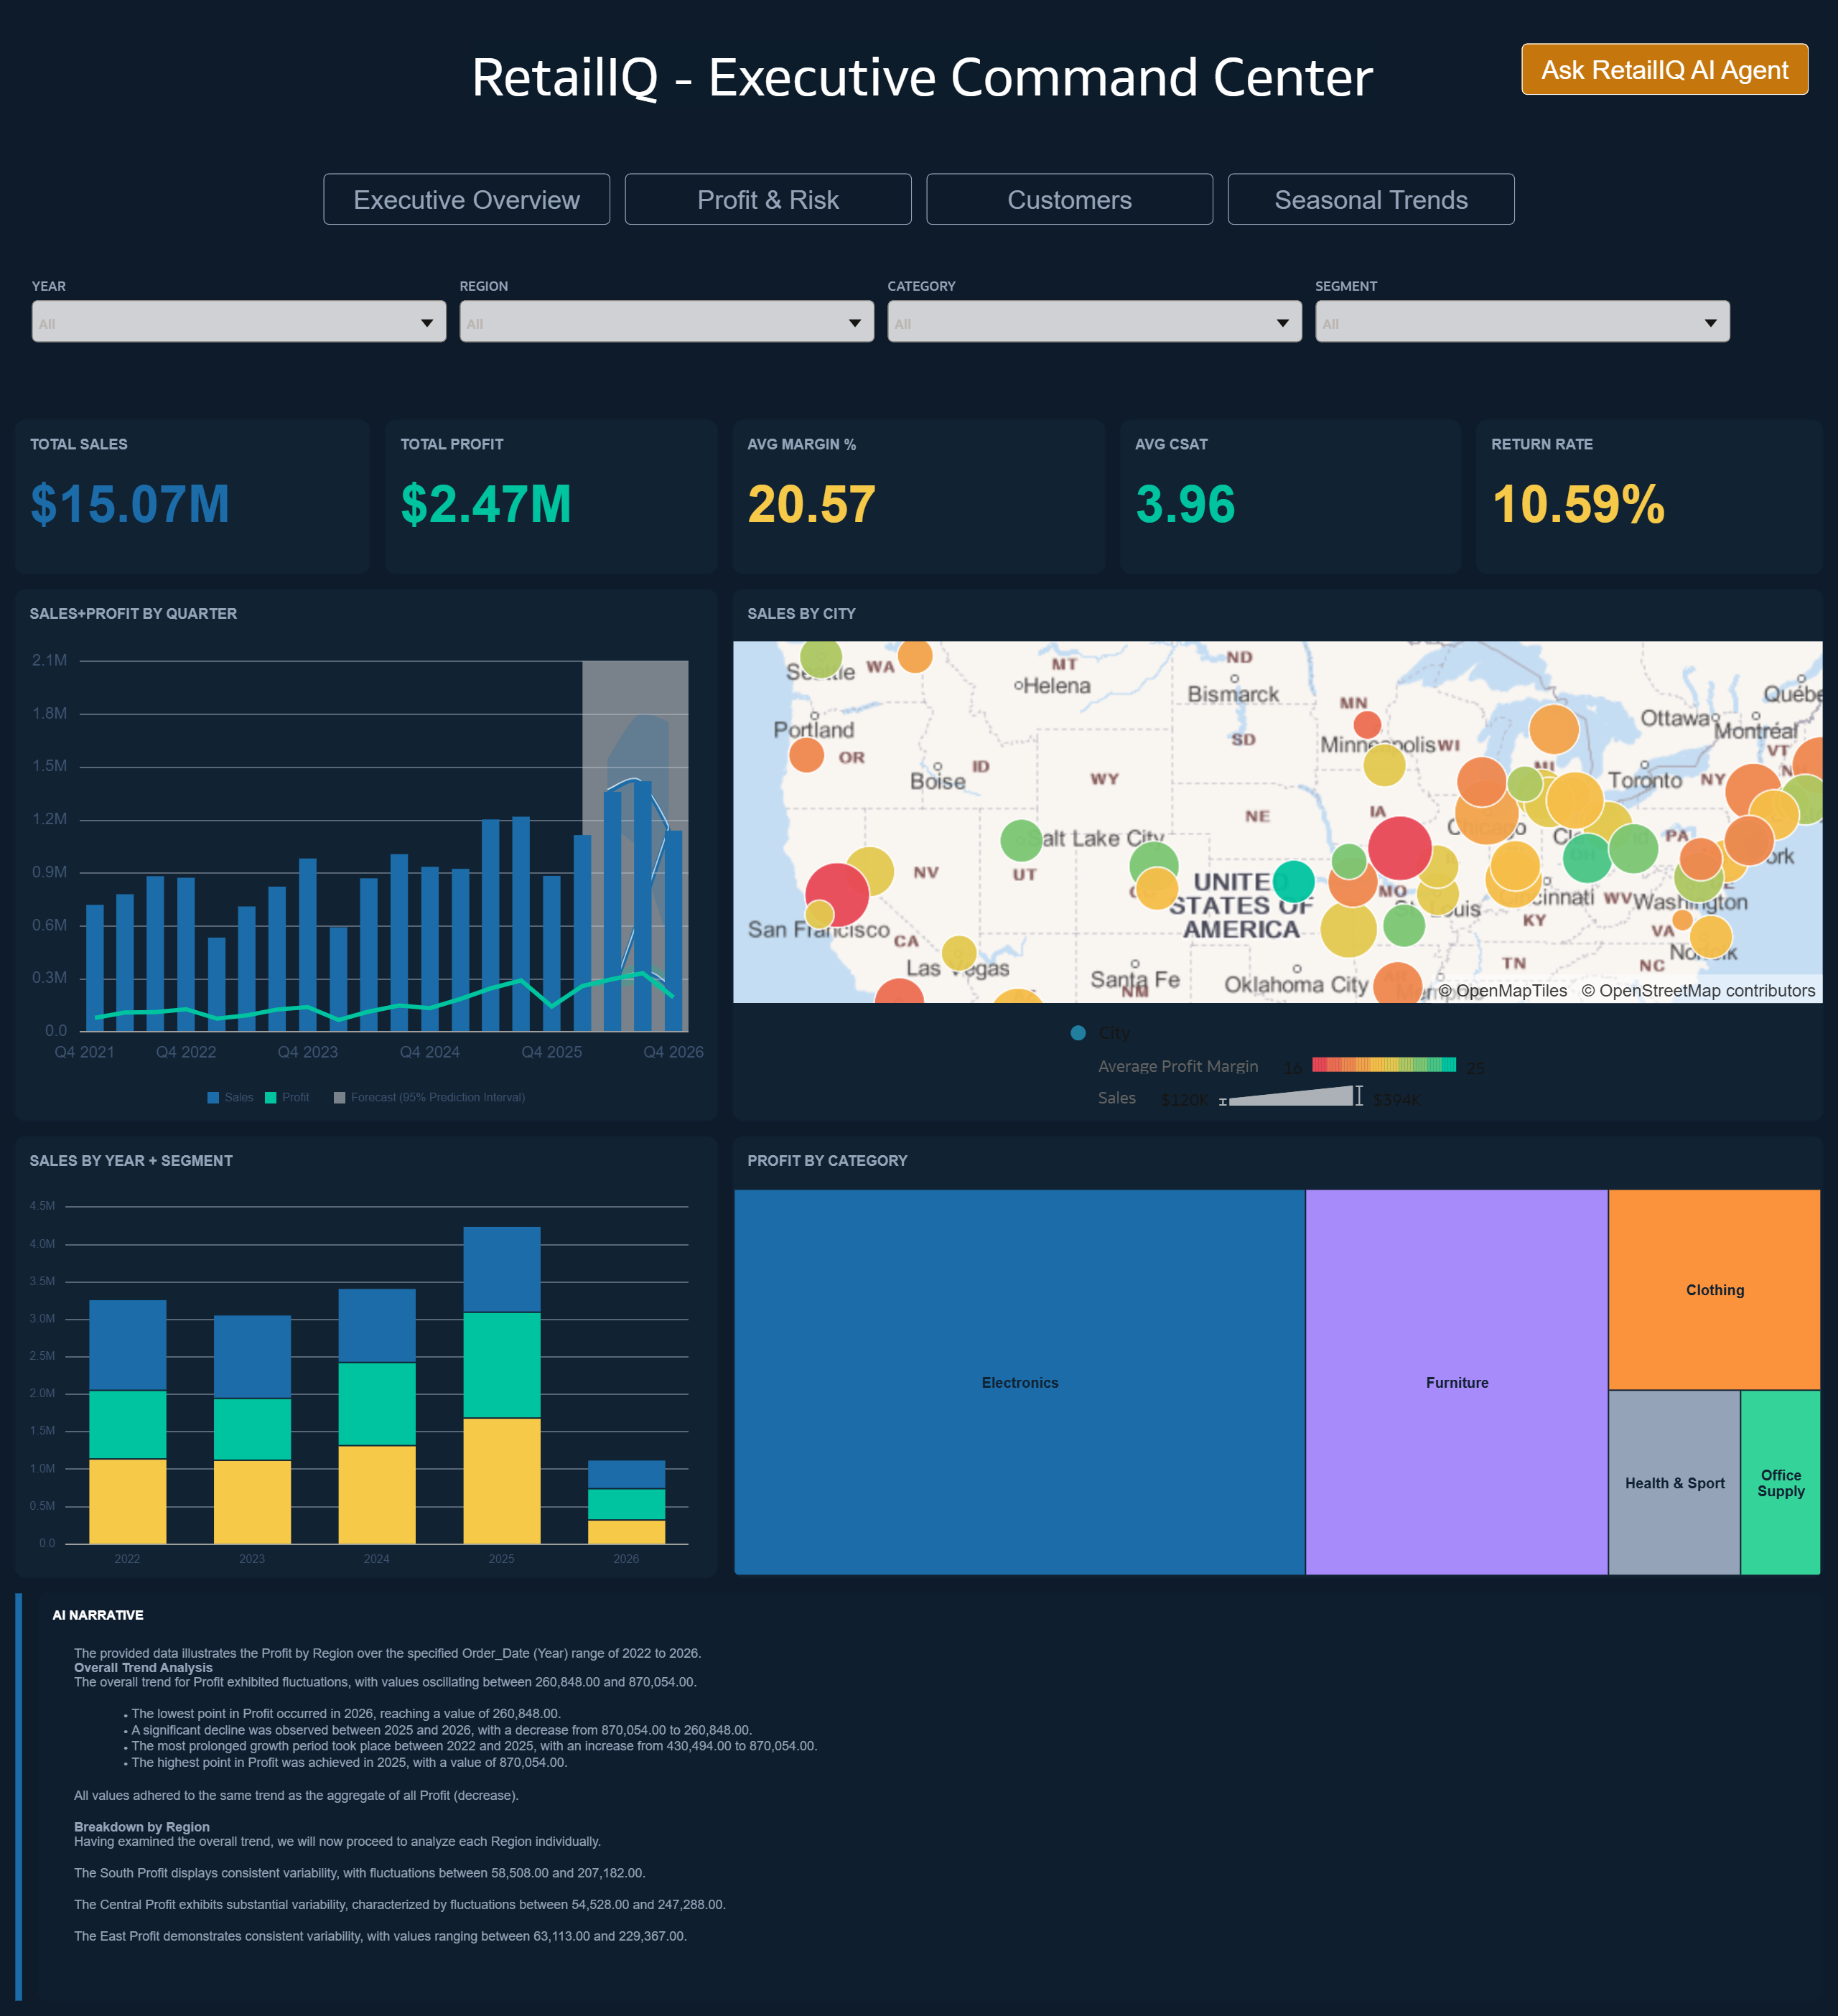
C1 Executive Command Centre: CEO / CFO / COO
5 headline KPIs, forecast line, bubble map and AI narrative. Designed for a 60-second executive briefing everything a C-suite leader needs without scrolling.
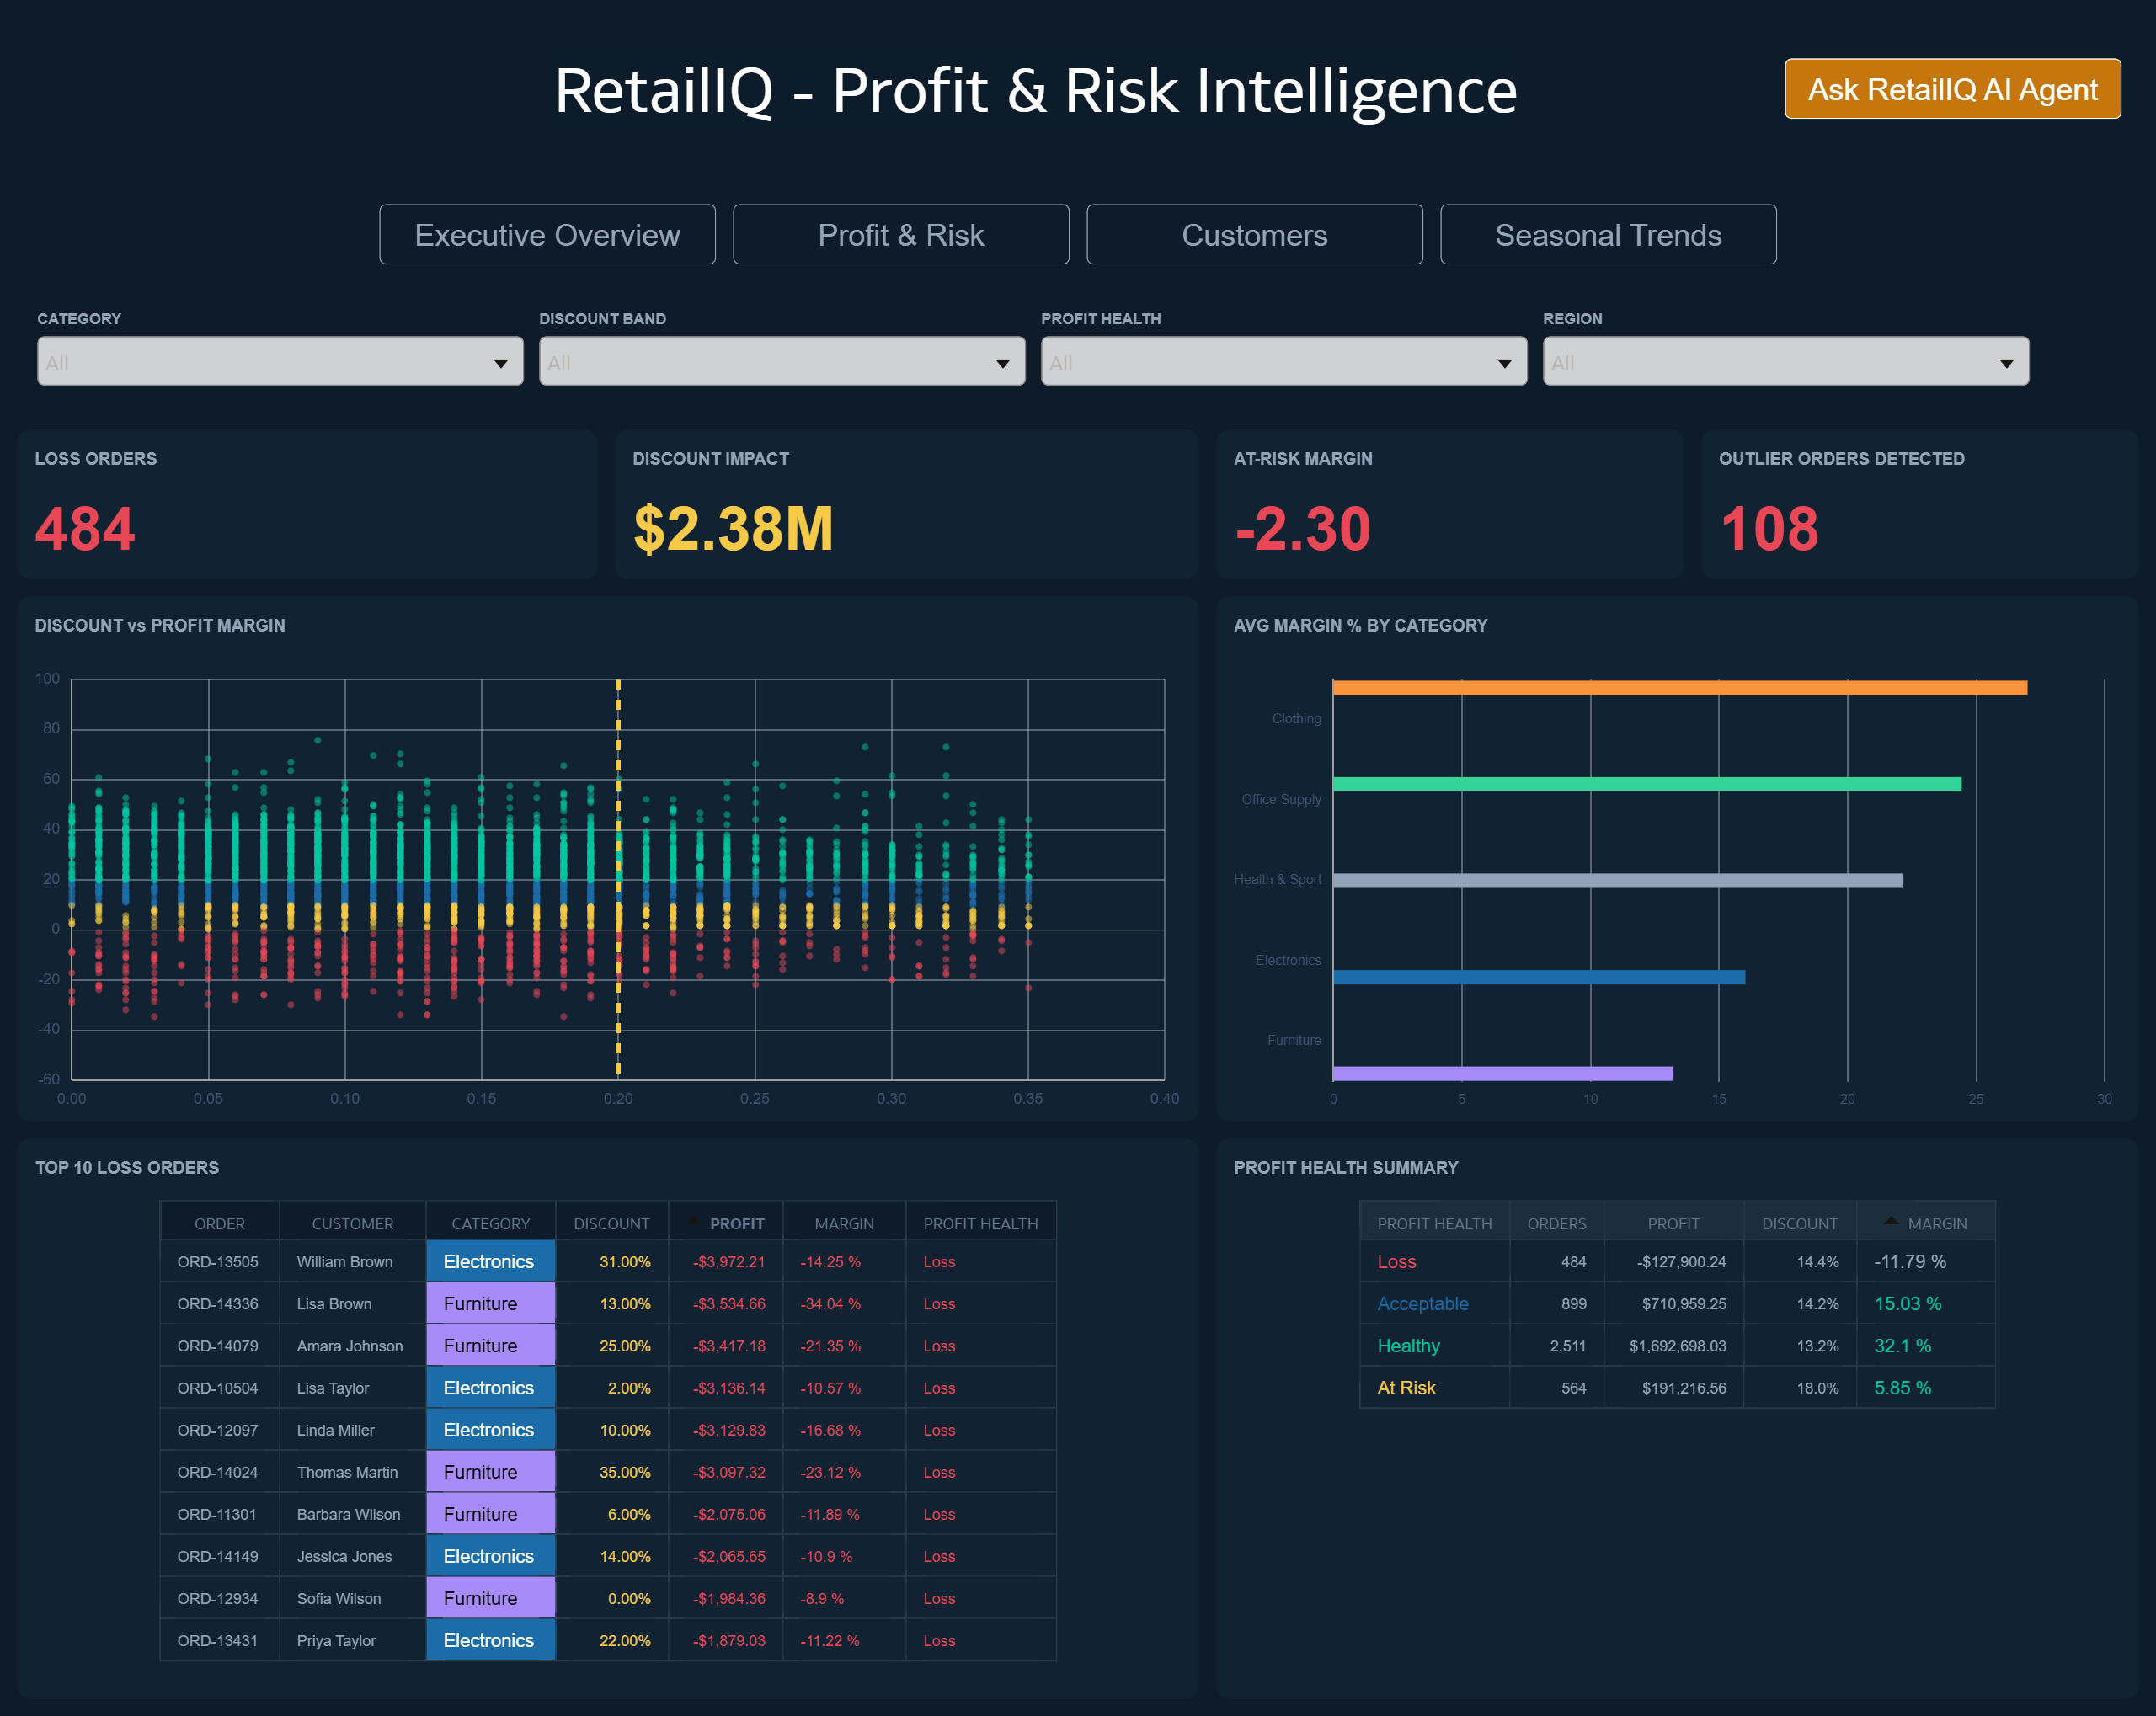
C2 Profit & Risk Intelligence: CFO / Finance Director / Risk Manager
Discount vs margin scatter, loss orders table. Designed for finance teams investigating margin leakage and pricing policy failures.
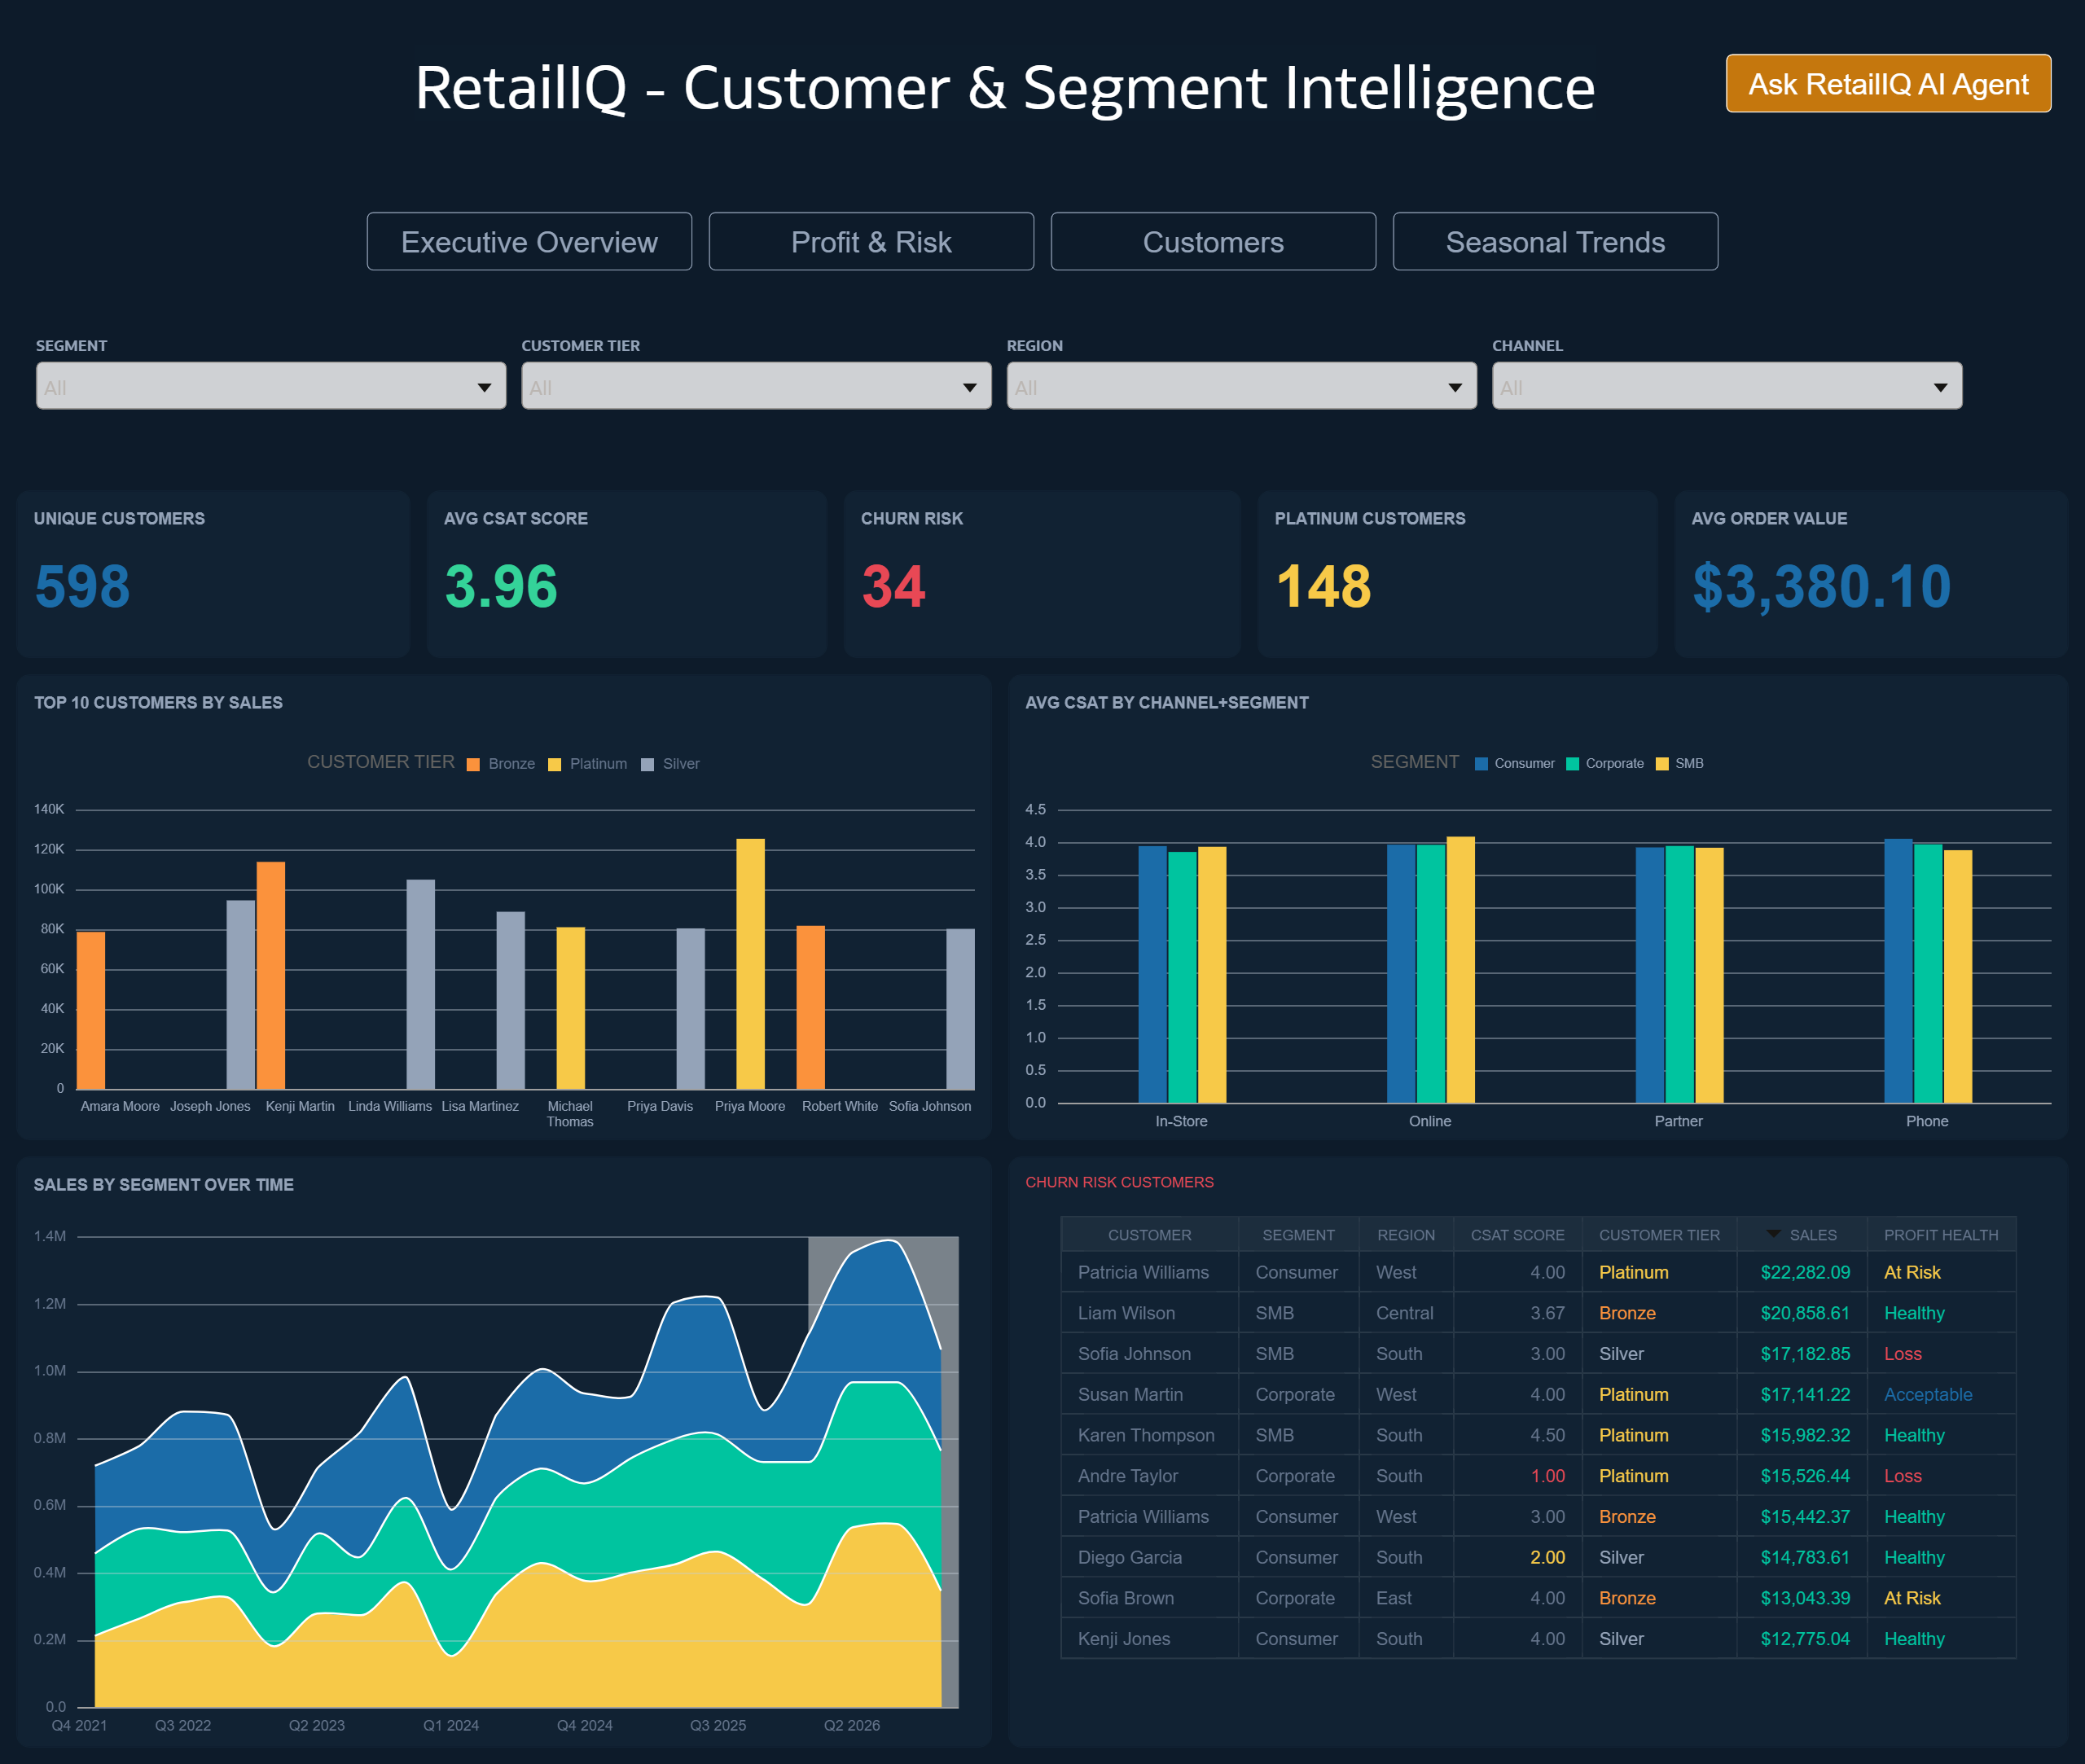
C3 Customer & Segment Intelligence: CMO / Customer Success / CRM Manager
Churn risk table, top customers by tier, CSAT by channel. Designed for customer-facing teams who need to act on retention and satisfaction signals.
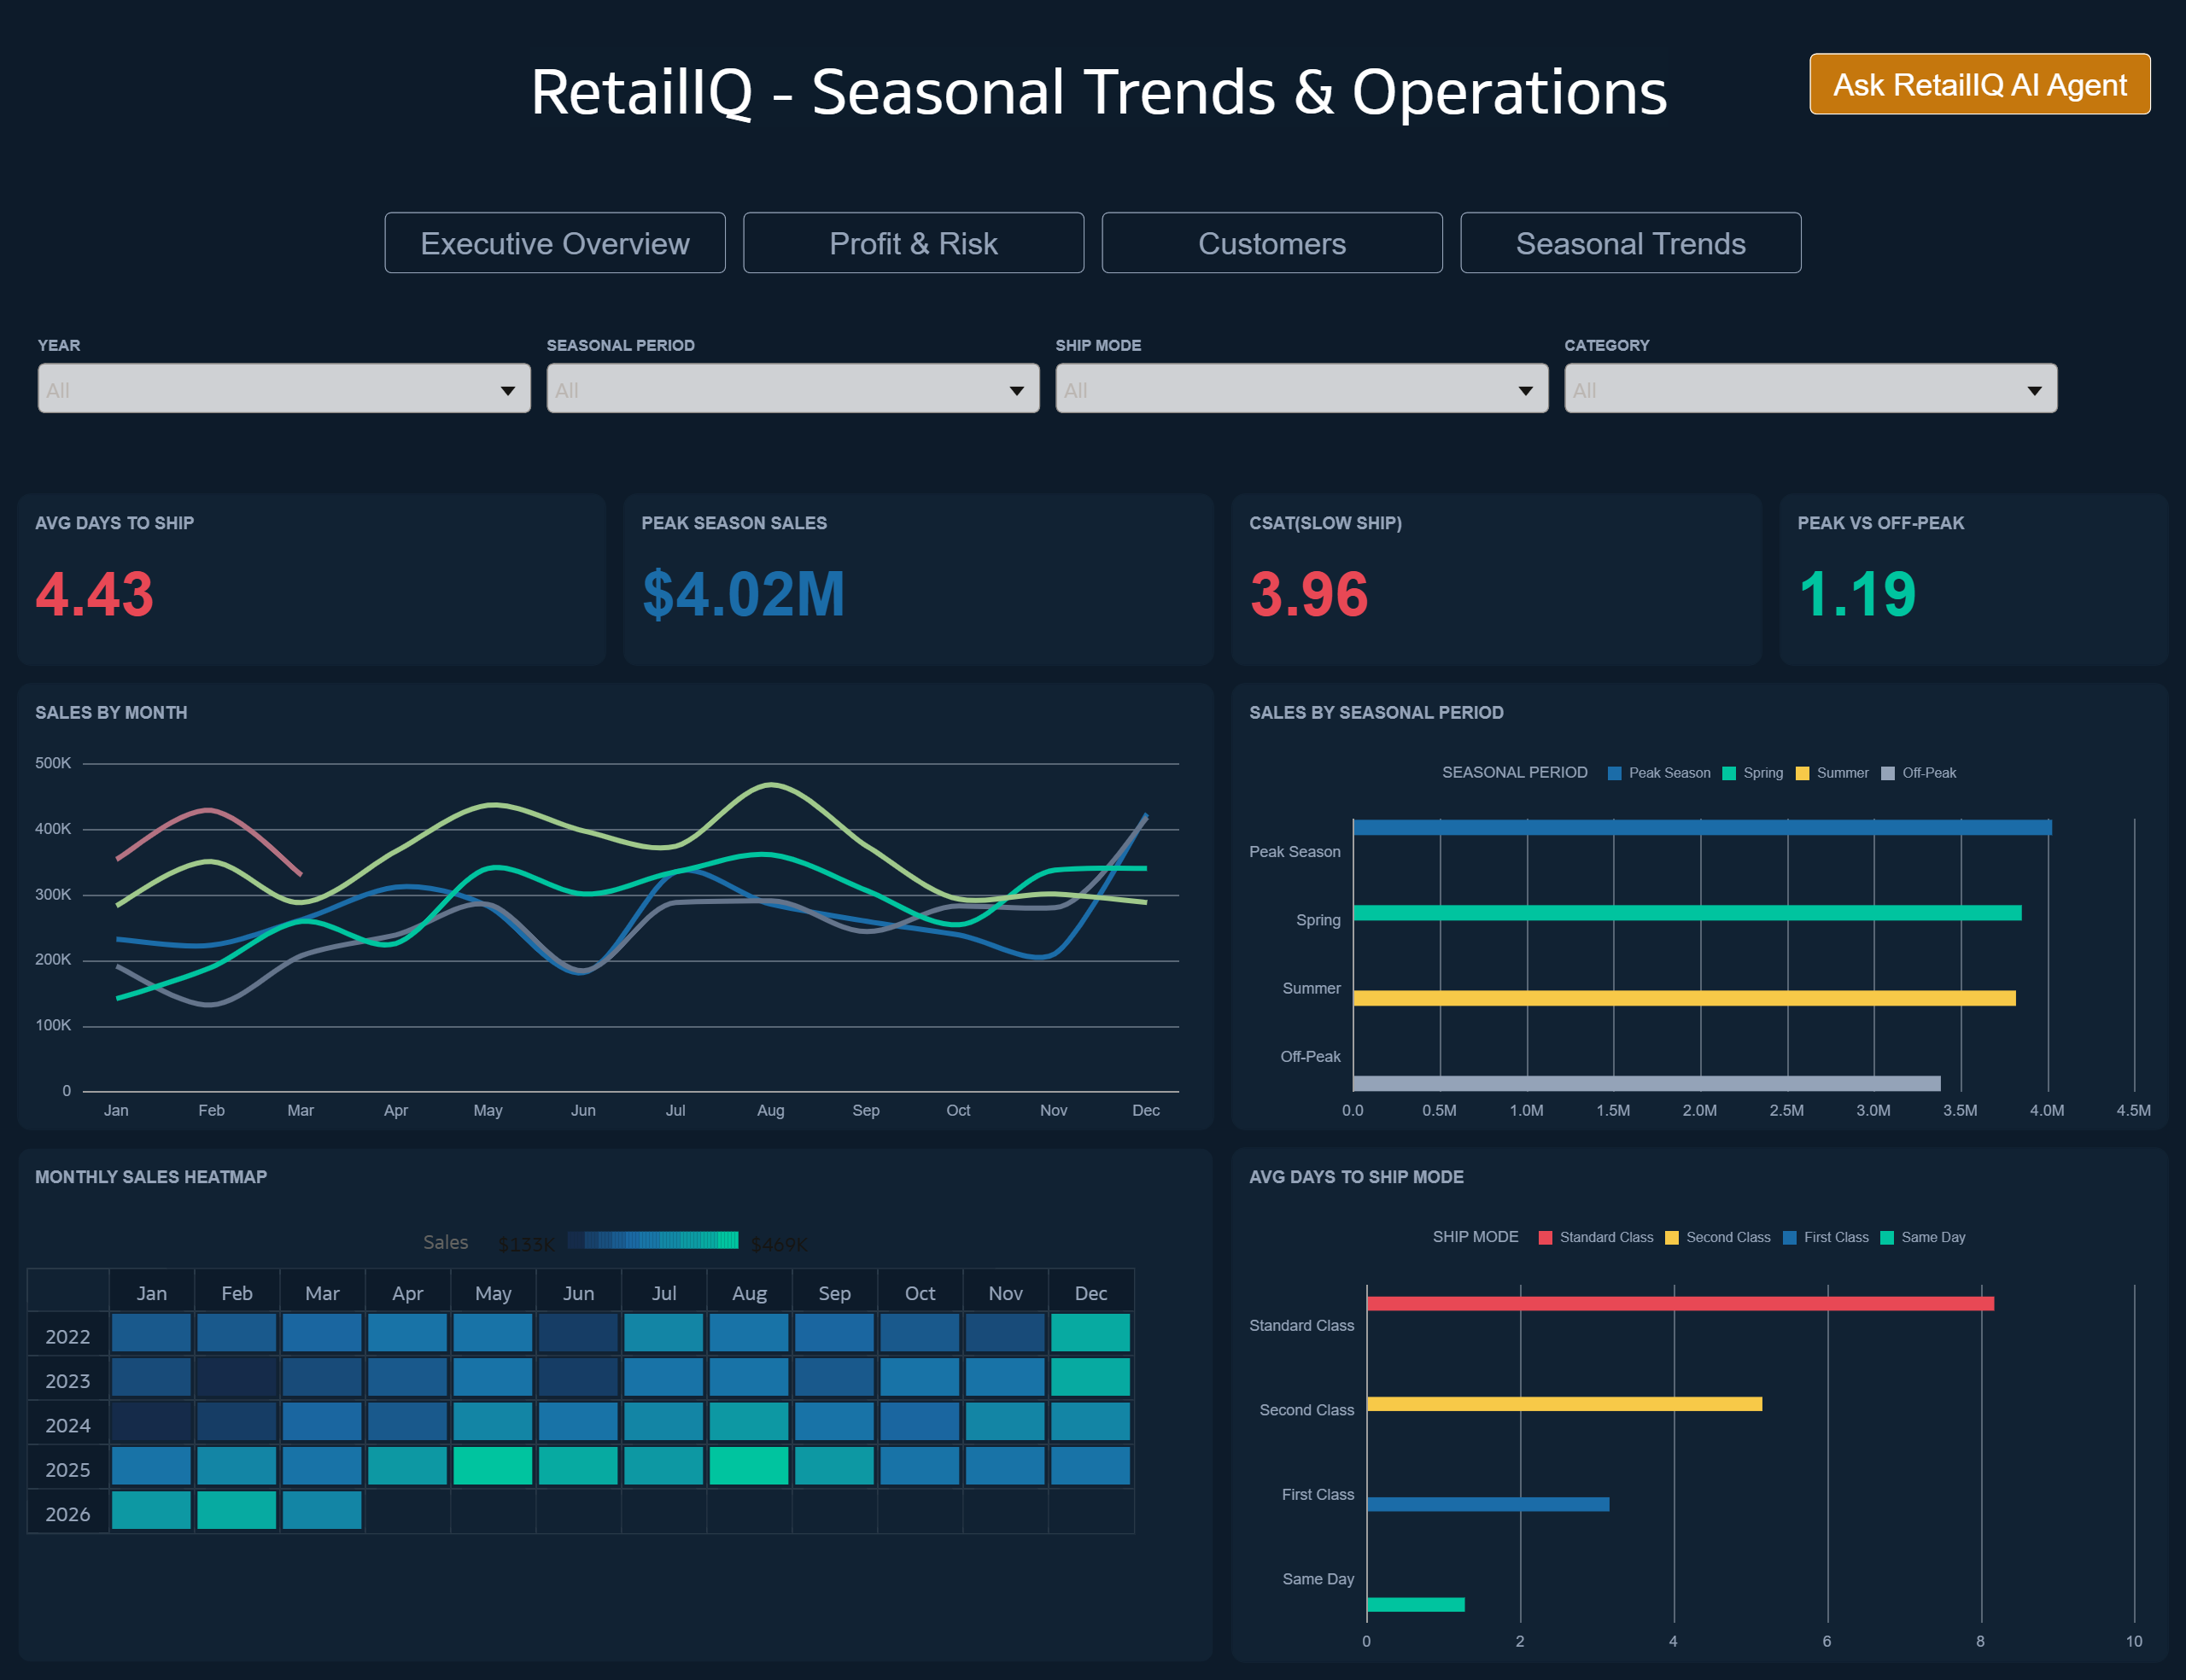
C4 Seasonal Trends & Operations: Supply Chain / Operations / Planning Manager
Monthly heatmap, ship mode analysis. Designed for operational teams planning inventory, staffing and logistics around seasonal demand patterns.
4.What is your visualization about, and what question or problem does it address?
RetailIQ addresses a fundamental retail business problem: leadership teams have data but lack the speed and depth of analysis to act on it before margin erodes, customers churn and forecasts are missed.
The core business questions RetailIQ answers:
- Where is our margin going?
- Which customers are about to leave?
- What does next quarter look like?
- What should I do right now? The AI Agent, grounded in a custom knowledge base with industry benchmarks, provides actionable recommendations in natural language
5. Did you use any Oracle Analytics AI features when building your visualization (ex. AI Assistant)? If so, please describe how they were used
Yes, Oracle Analytics AI features are not supplementary to RetailIQ. They are the foundation. Every canvas uses at least one AI feature. The dashboard was built around AI capabilities, not the other way around.
Summary of all AI features used:
a. Language Narrative (AI-written text)
Deployed on C1.The Language Narrative tile analyses the data in scope and writes a plain-English paragraph. The narrative updates in real time when dashboard filters change
b. AI Forecast (Machine Learning)
Applied to the Sales+Profit by Quarter chart on C1 (4-period forecast)
c. AI Explain,key Insights and AI Assistant
Used to generate visualizations
d. AI Agent (Conversational Analytics)
The RetailIQ AI Agent is present on all canvases. It is grounded with a custom Knowledge Base PDF containing industry benchmarks for retail KPIs, recommended actions by profit health tier, and definitions of all 36 dataset columns. This means the agent does not just query data; it benchmarks results against industry standards.
The combination of grounded knowledge base + live dataset querying + natural language output represents the highest level of Oracle Analytics AI Agent capability demonstrated in this submission.
6. Did you upload your visualization image and dva file?
Yes
