1. Which dataset did you use?
Superstore Dataset provided by Oracle
2. How did you analyze or prepare the data?
I used Auto-Insights to understand the data and created some custom parameters and calculations to analyze the data.
3. Who is the intended audience for your visualization?
Superstore Sales manager, Decision Makers
4. What is your visualization about, and what question or problem does it address?
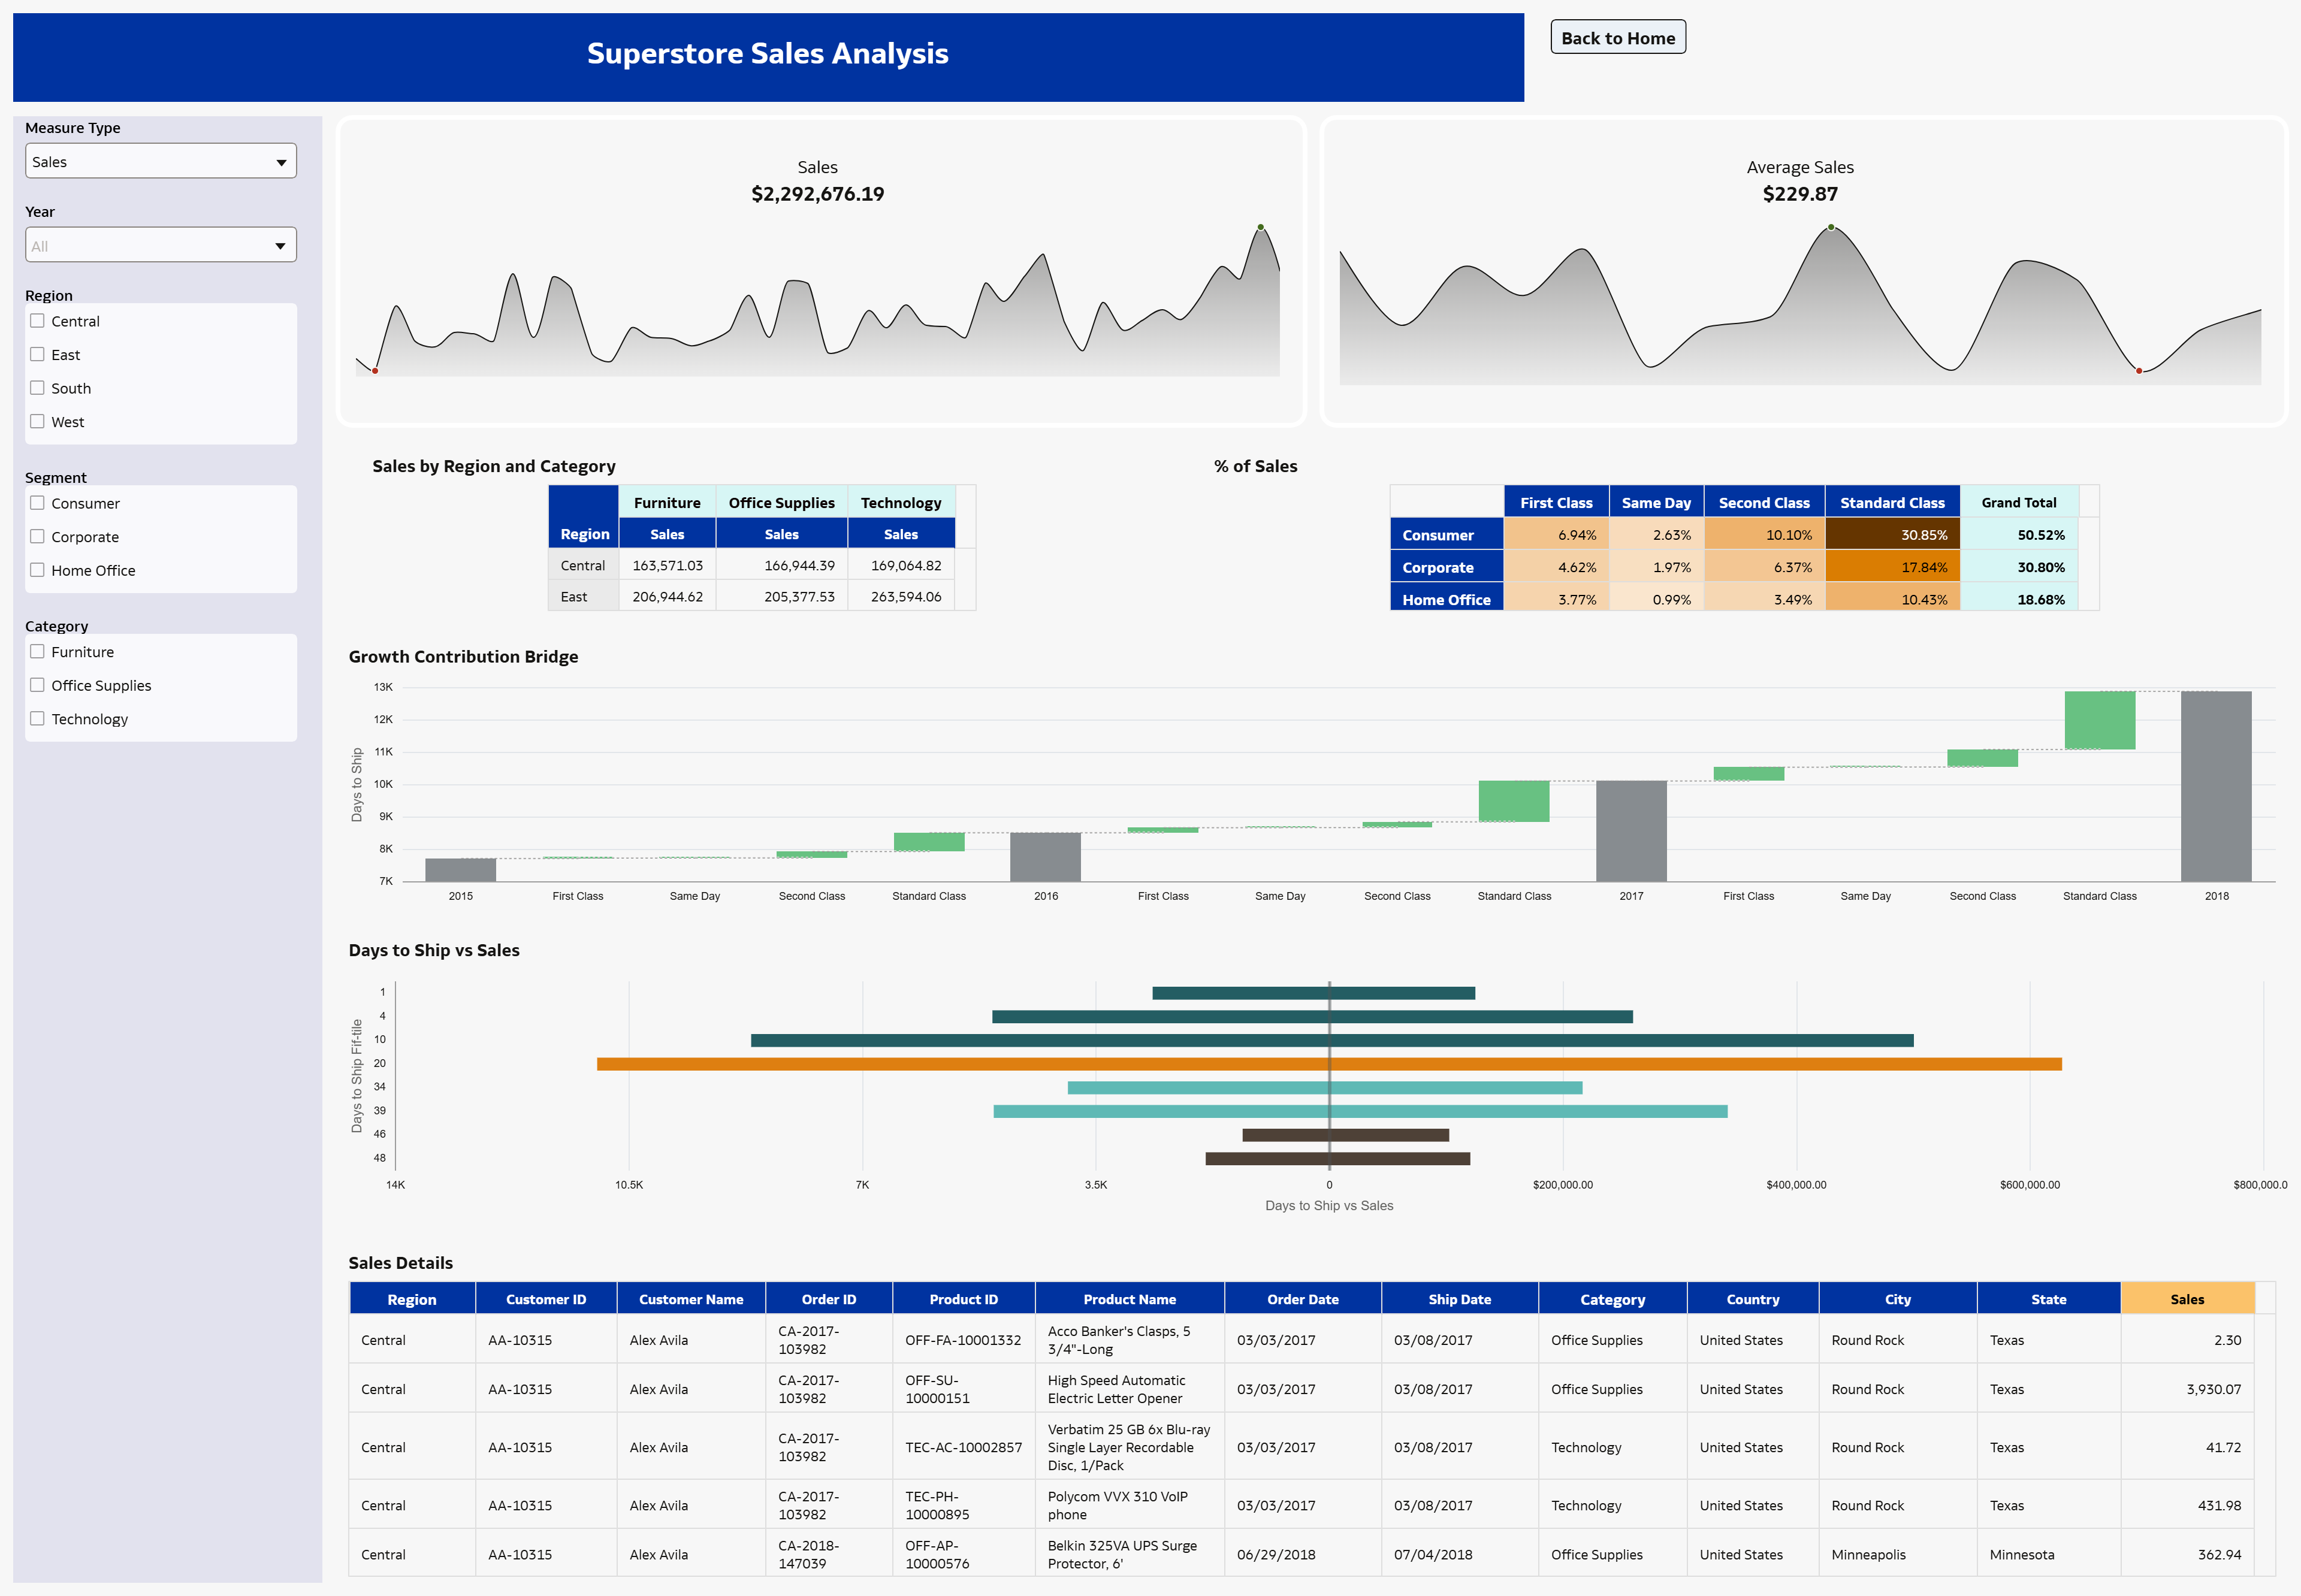
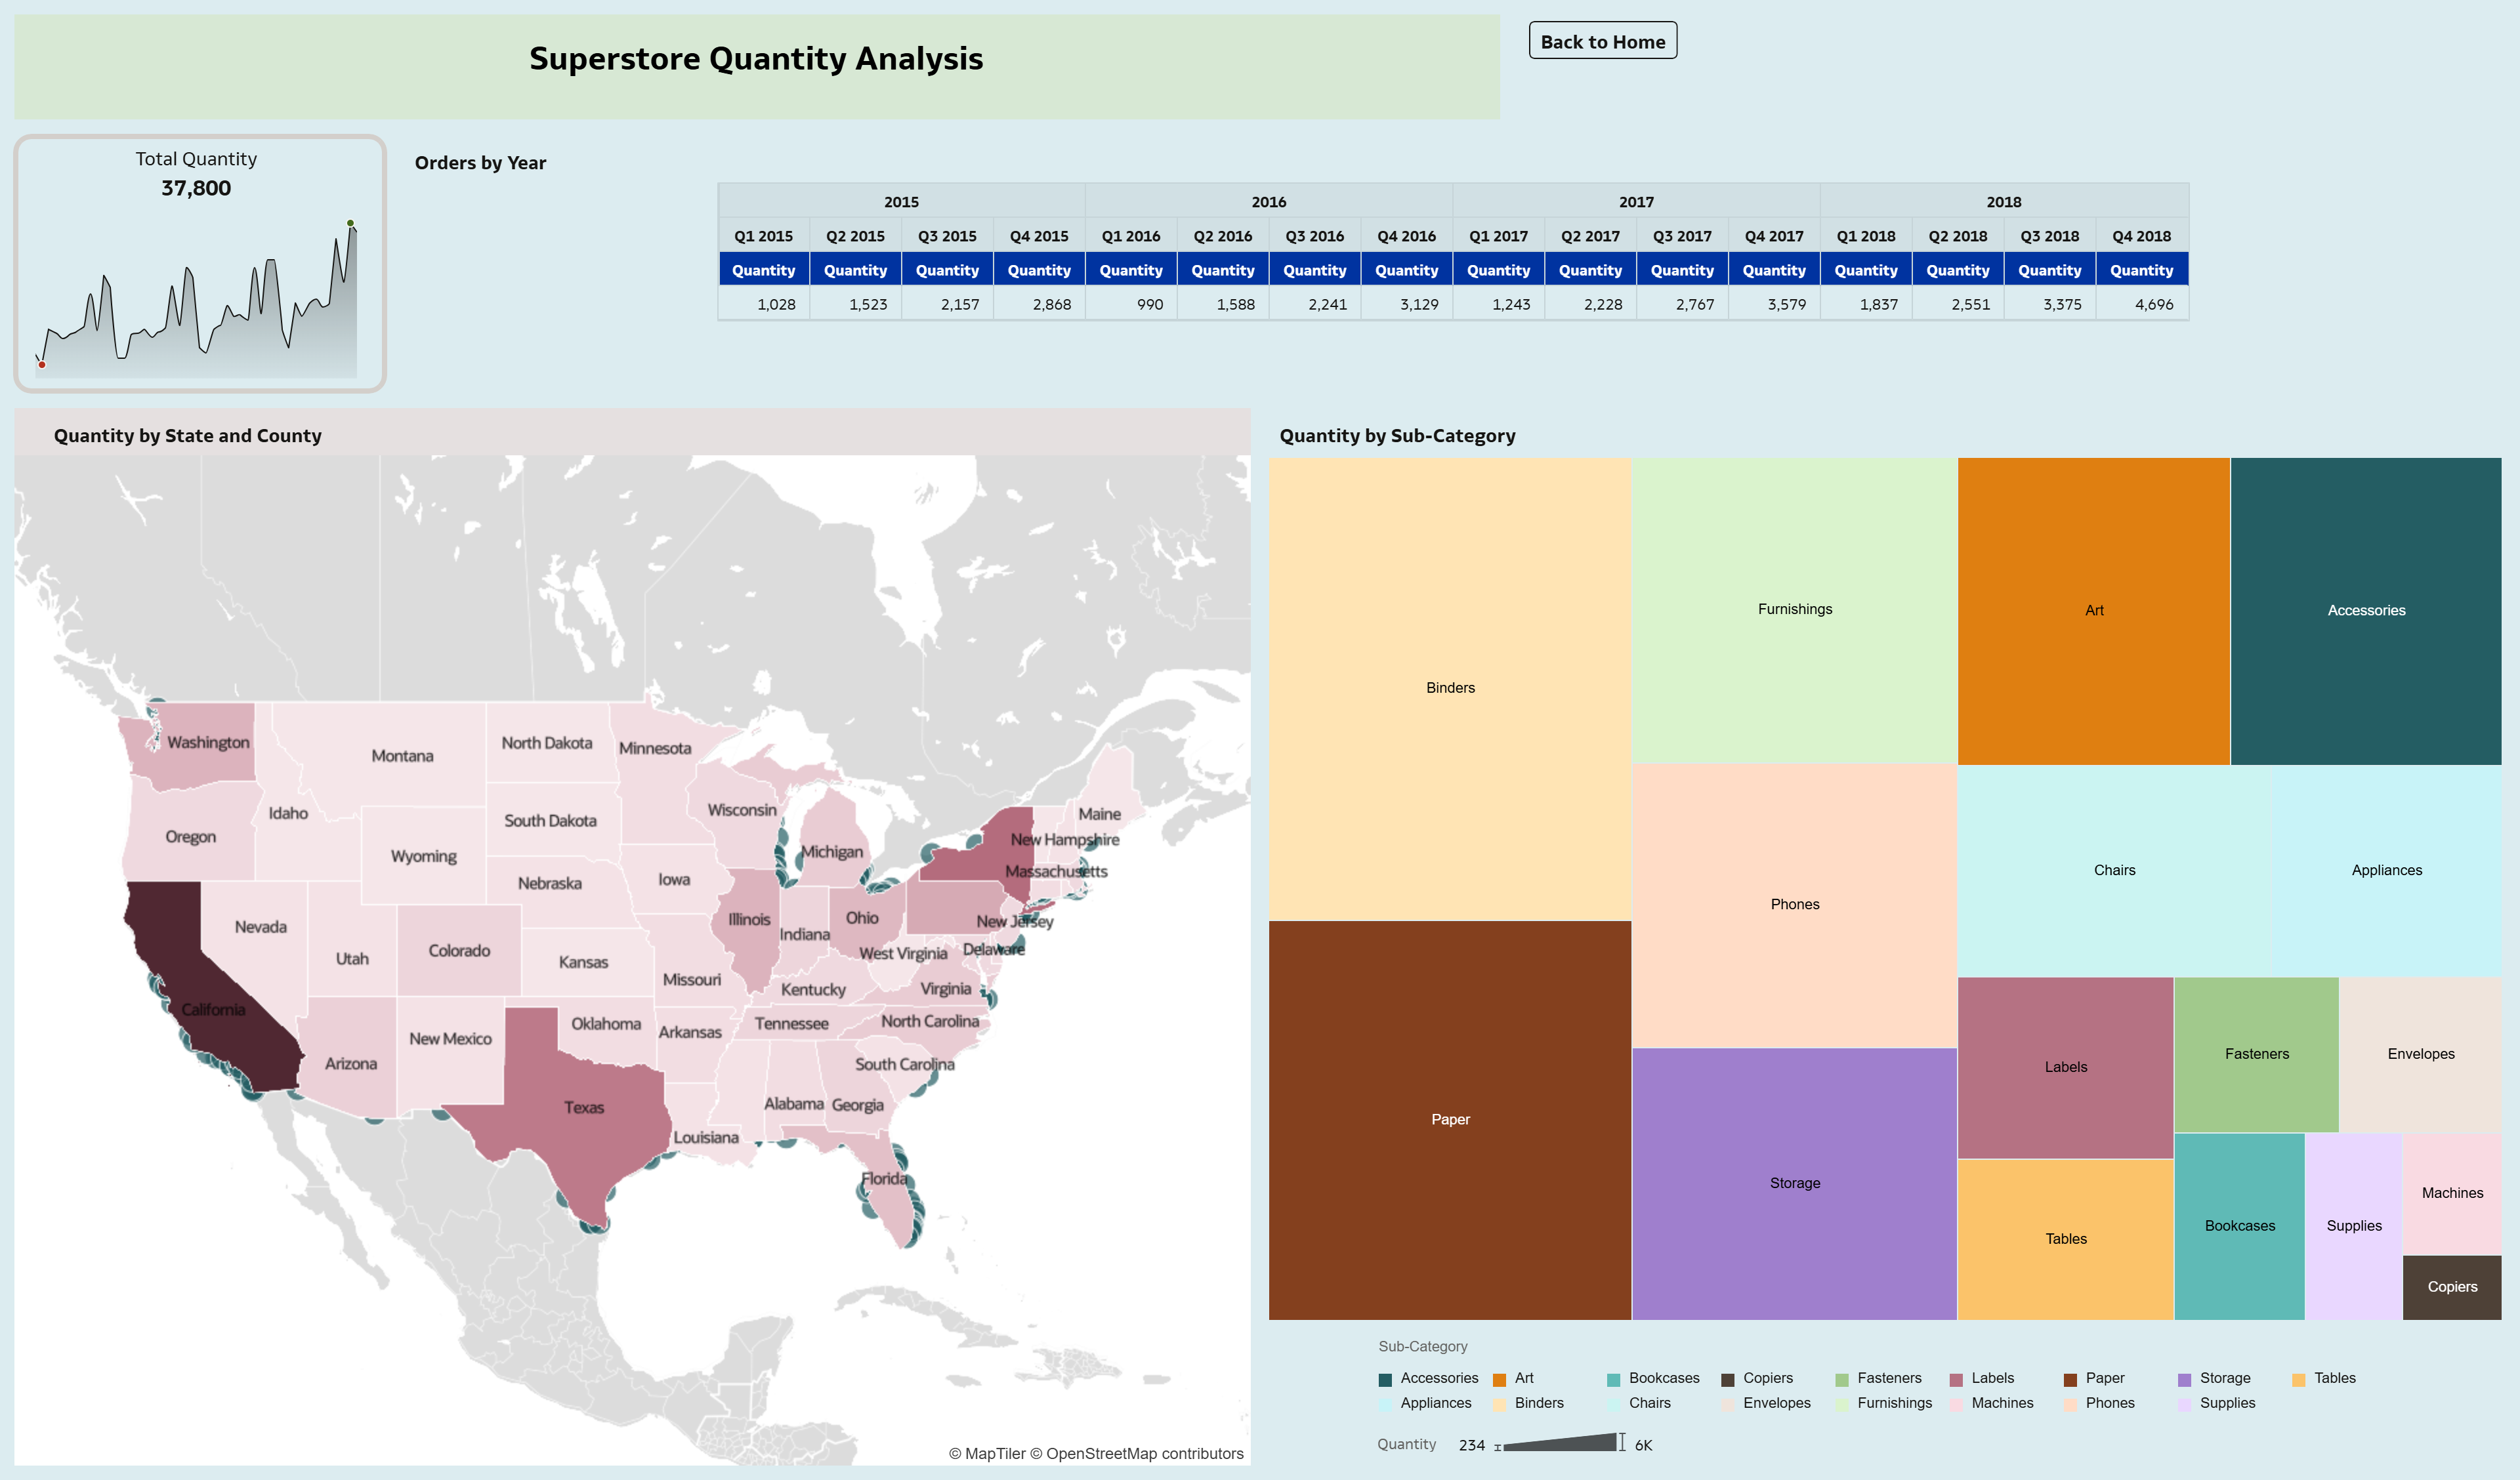
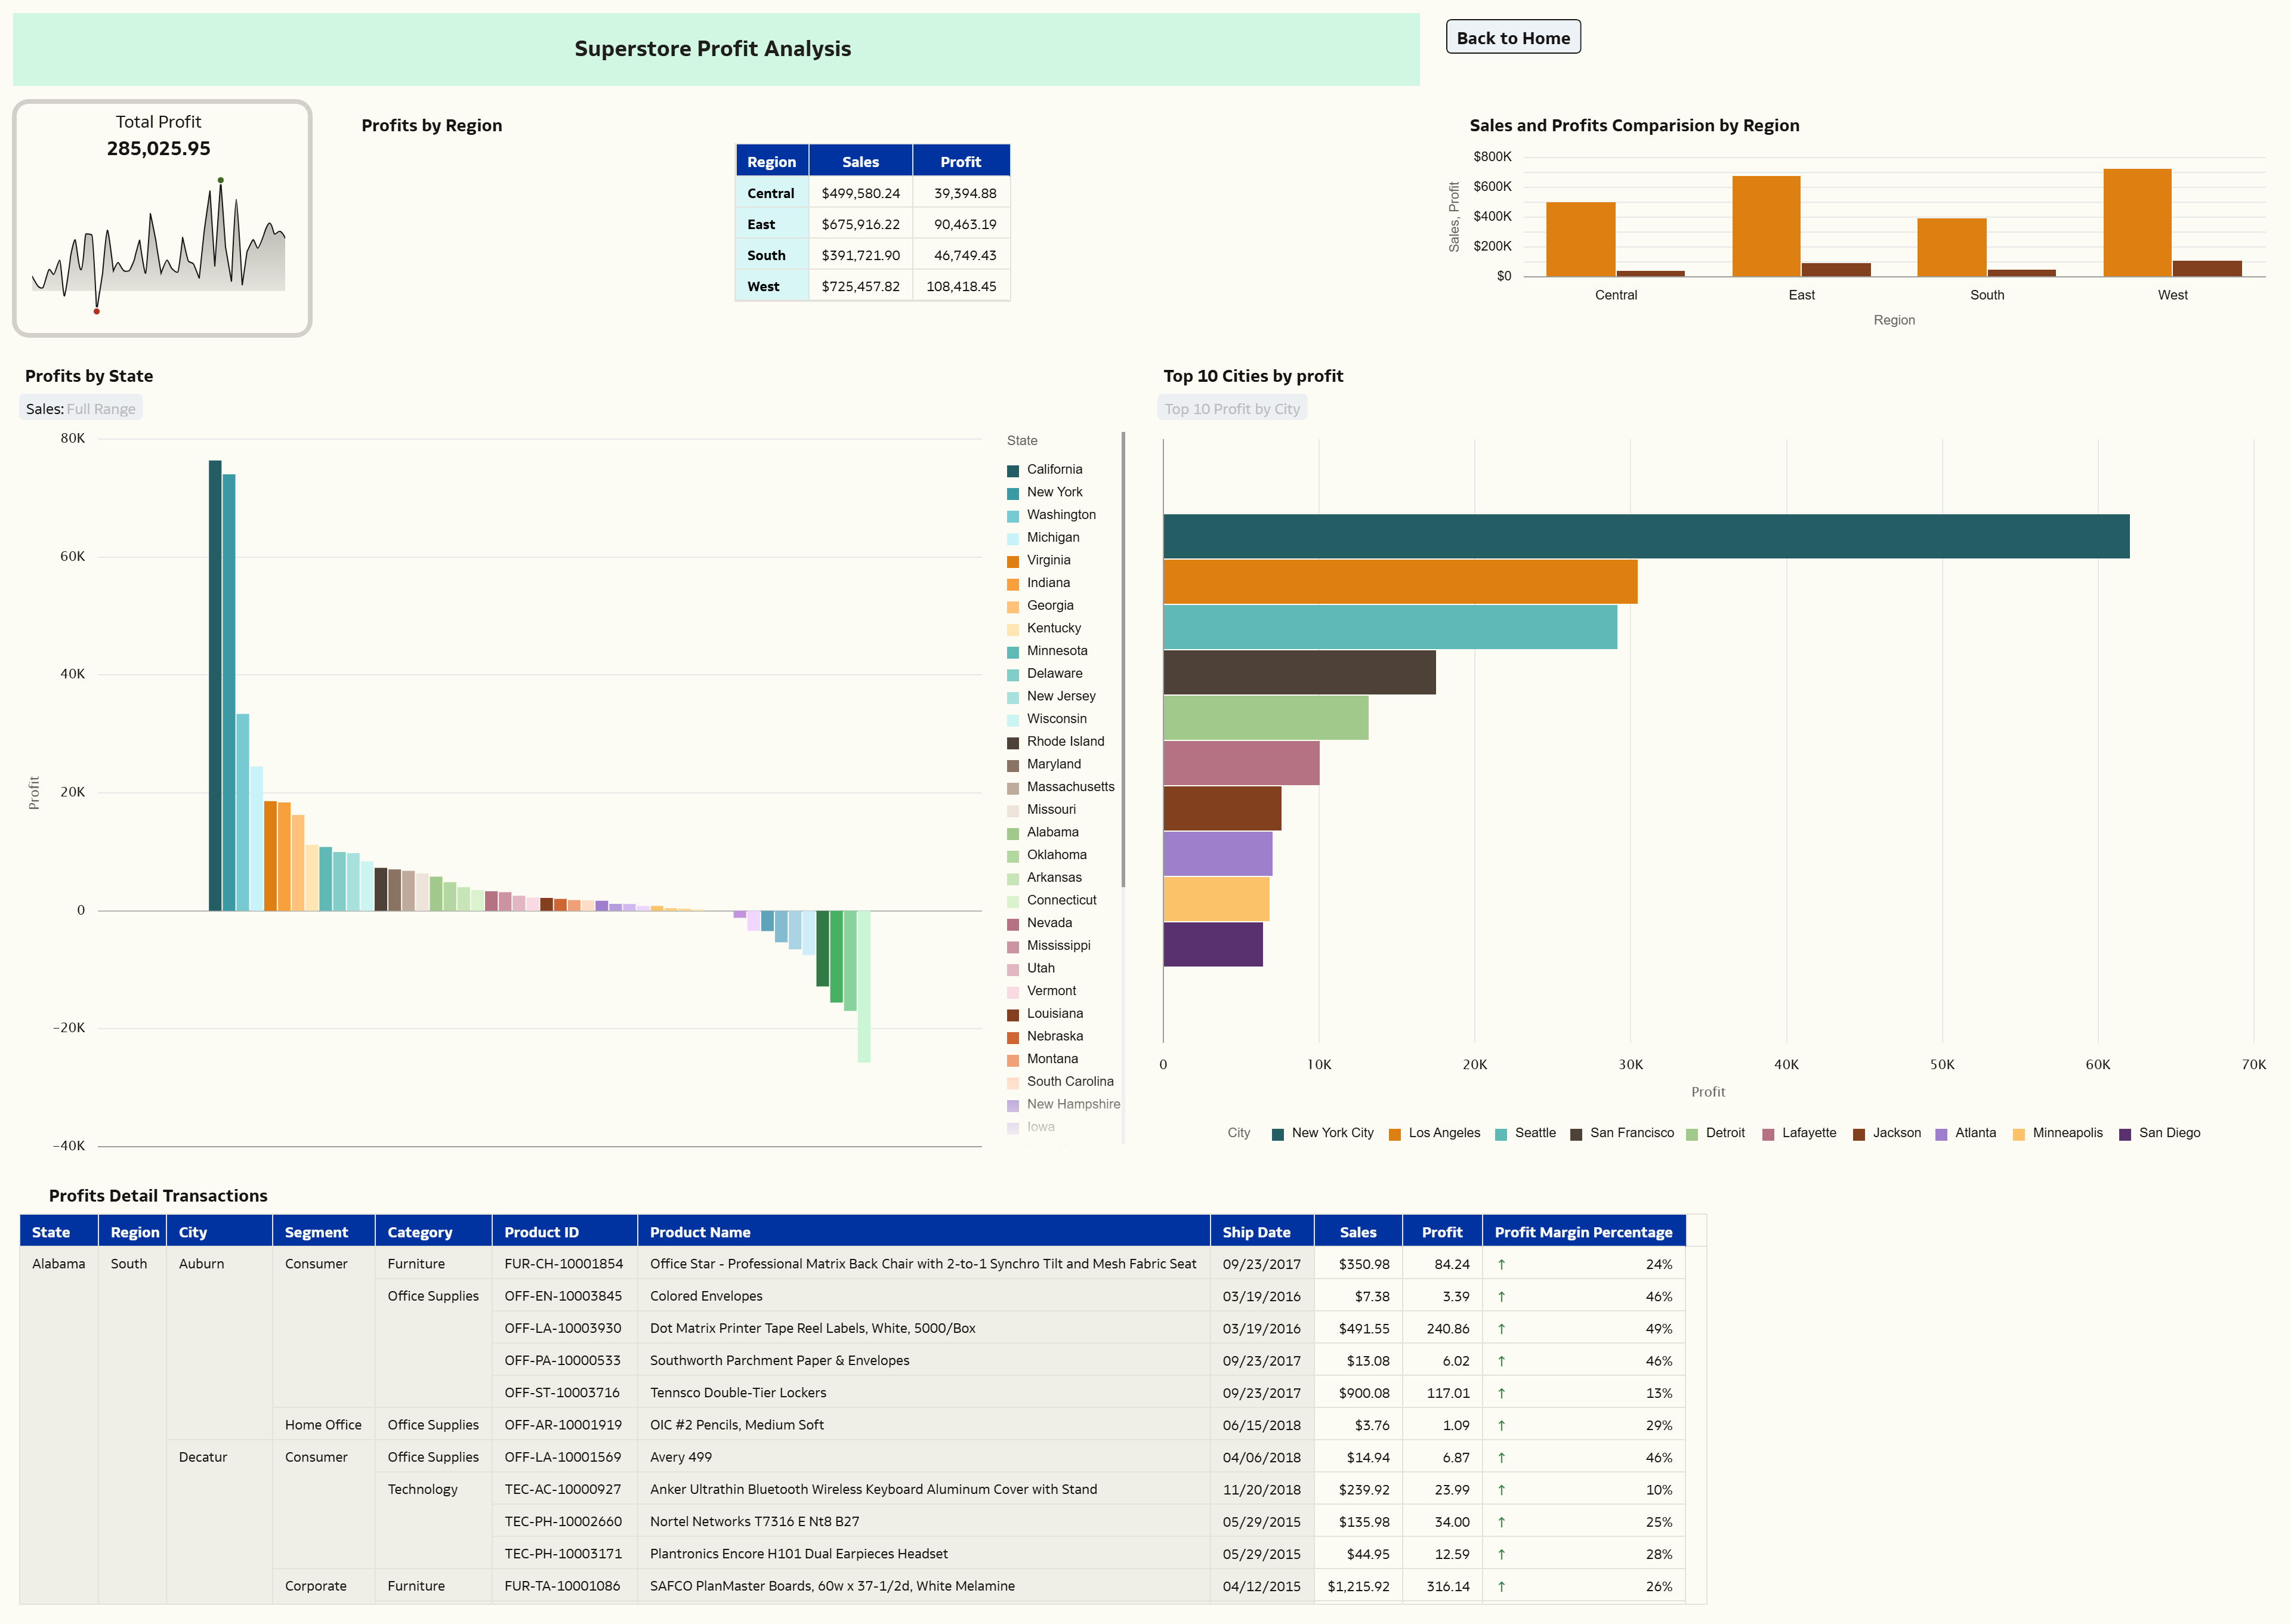
My data visualization focuses on key retail metrics such as:
- Sales (revenue generated)
- Profit (earnings after costs)
- Orders & Quantity
- Customer segments (Consumer, Corporate, Home Office)
- Product categories (Furniture, Technology, Office Supplies)
- Geography (Region, State, City)
The goal is to give a complete view of how the business is performing across different dimensions.
5. Did you use any Oracle Analytics AI features when building your visualization (ex. AI Assistant)? If so, please describe how they were used
Yes, used the AI Assistant to ask questions like Show sales by Region,Top 10 products by profit and It automatically generated relevant visualizations, helping speed up initial exploration.
6. Did you upload your visualization image and dva file?
Yes, I have uploaded both the visualization image and the DVA file.
