- 1. Which dataset did you use?
I used a synthetic Social Media Analytics dataset designed to simulate real-world digital marketing performance across multiple platforms such as Instagram, Facebook, LinkedIn, YouTube, Twitter, and TikTok.
The dataset includes key metrics such as:
Engagement data (likes, views, shares, saves)
Reach and impressions
Content attributes (content type, title, hashtags)
Platform-specific performance
Audience geography (region-wise distribution)
Time-based attributes (post date, day, month)
Additionally, the dataset was enriched with calculated fields such as:
Engagement Rate
Likes per Record
Saves per Record
Performance ratios (likes vs saves)
This structure enables multi-dimensional analysis of content performance, audience behavior, and platform effectiveness.
2. How did you analyze or prepare the data?
Data preparation and analysis were performed using Oracle Analytics Cloud (OAC).Key steps included:
Data Cleaning & Standardization:
- Ensured consistency in platform names and content types
- Standardized date formats for time-series analysis
Derived Metrics Creation:
- Engagement Rate (based on likes, shares, views)
- Likes per Record & Saves per Record
- Ratio metrics to compare engagement quality
Time-Based Transformations:
- Extracted Month, Day, and Time slots
- Enabled monthly trend analysis and best time to post insights
Aggregation & Validation:
- Validated totals (likes, views, saves) to avoid duplication
- Ensured proper aggregation across platforms
Advanced Structuring:
- Grouped content into categories (Image, Video, etc.)
- Created platform-level and region-level hierarchies
3. Who is the intended audience?
This dashboard is designed for:
Digital Marketing Teams → to track campaign and content performance
Business & Brand Managers → to monitor overall social media growth
Content Strategists → to identify high-performing content types and best posting times
Social Media Analysts → to analyze engagement patterns and audience behavior
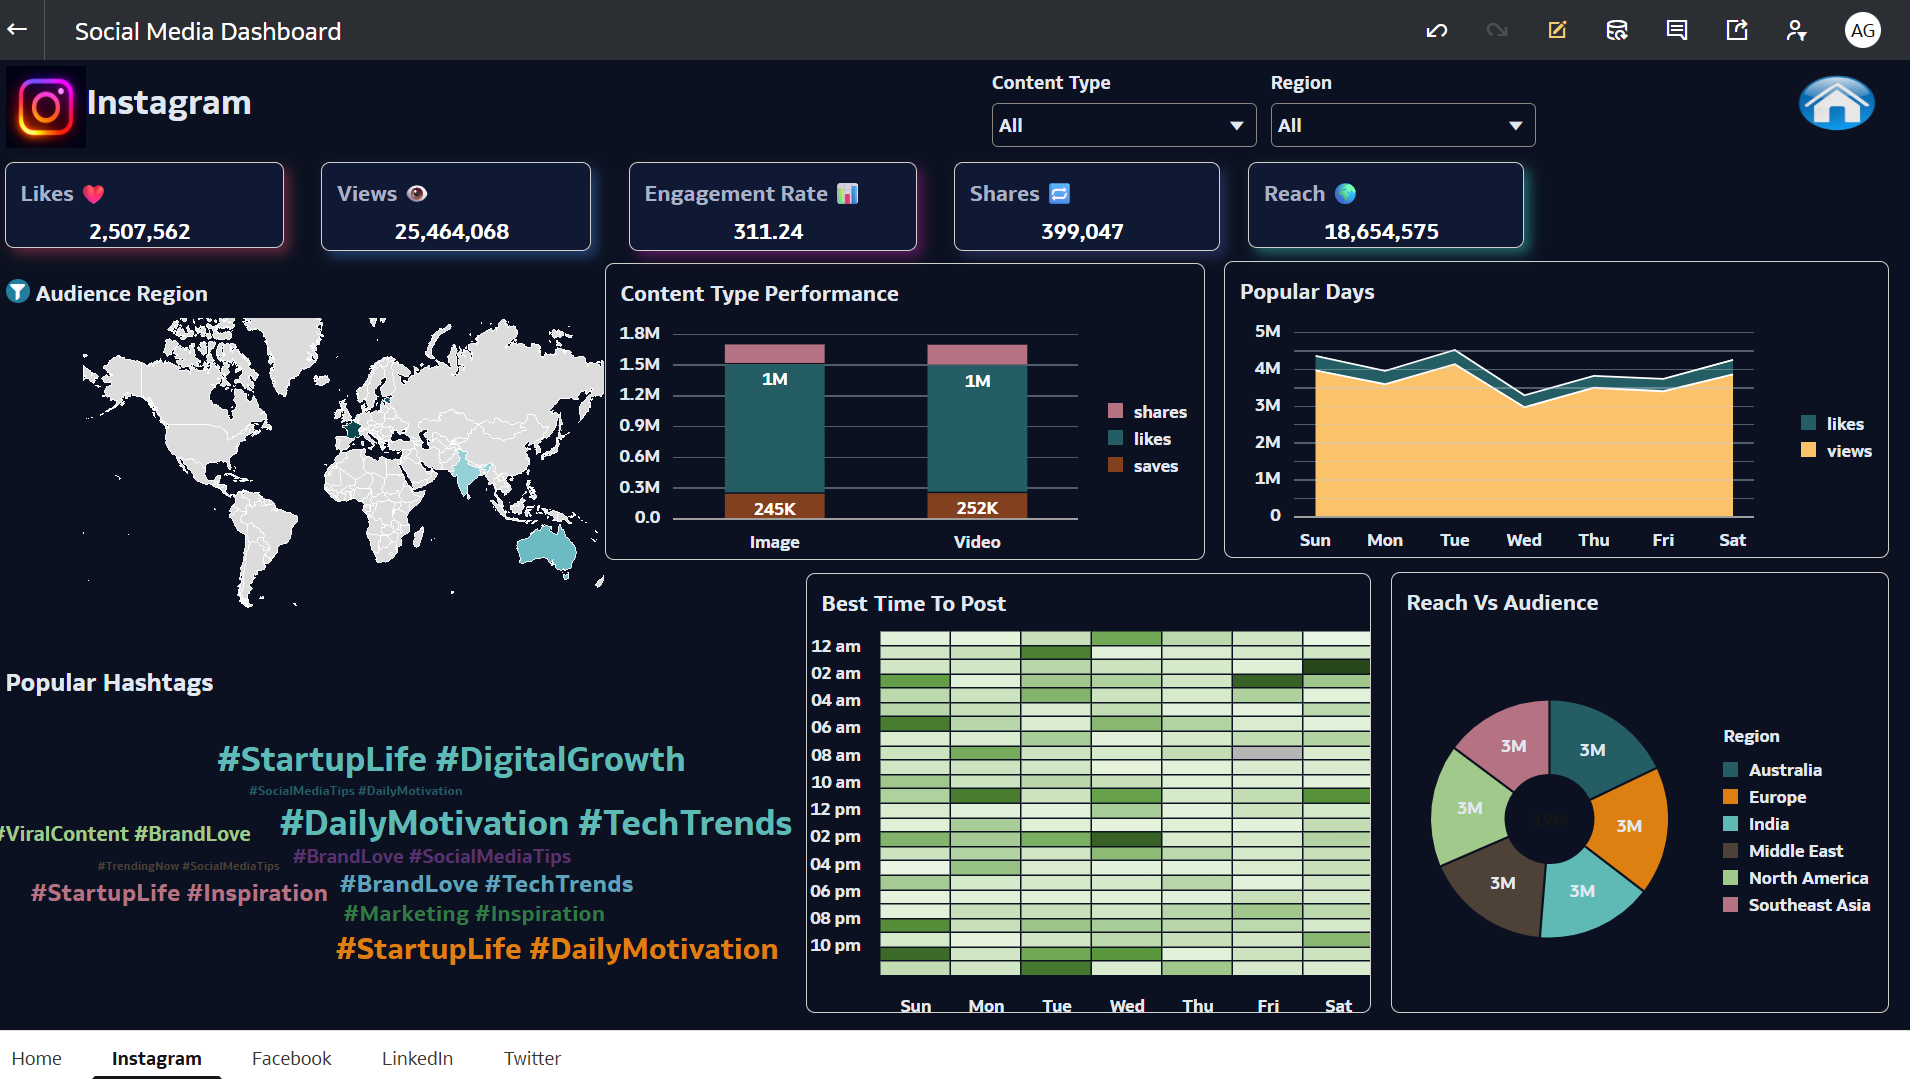
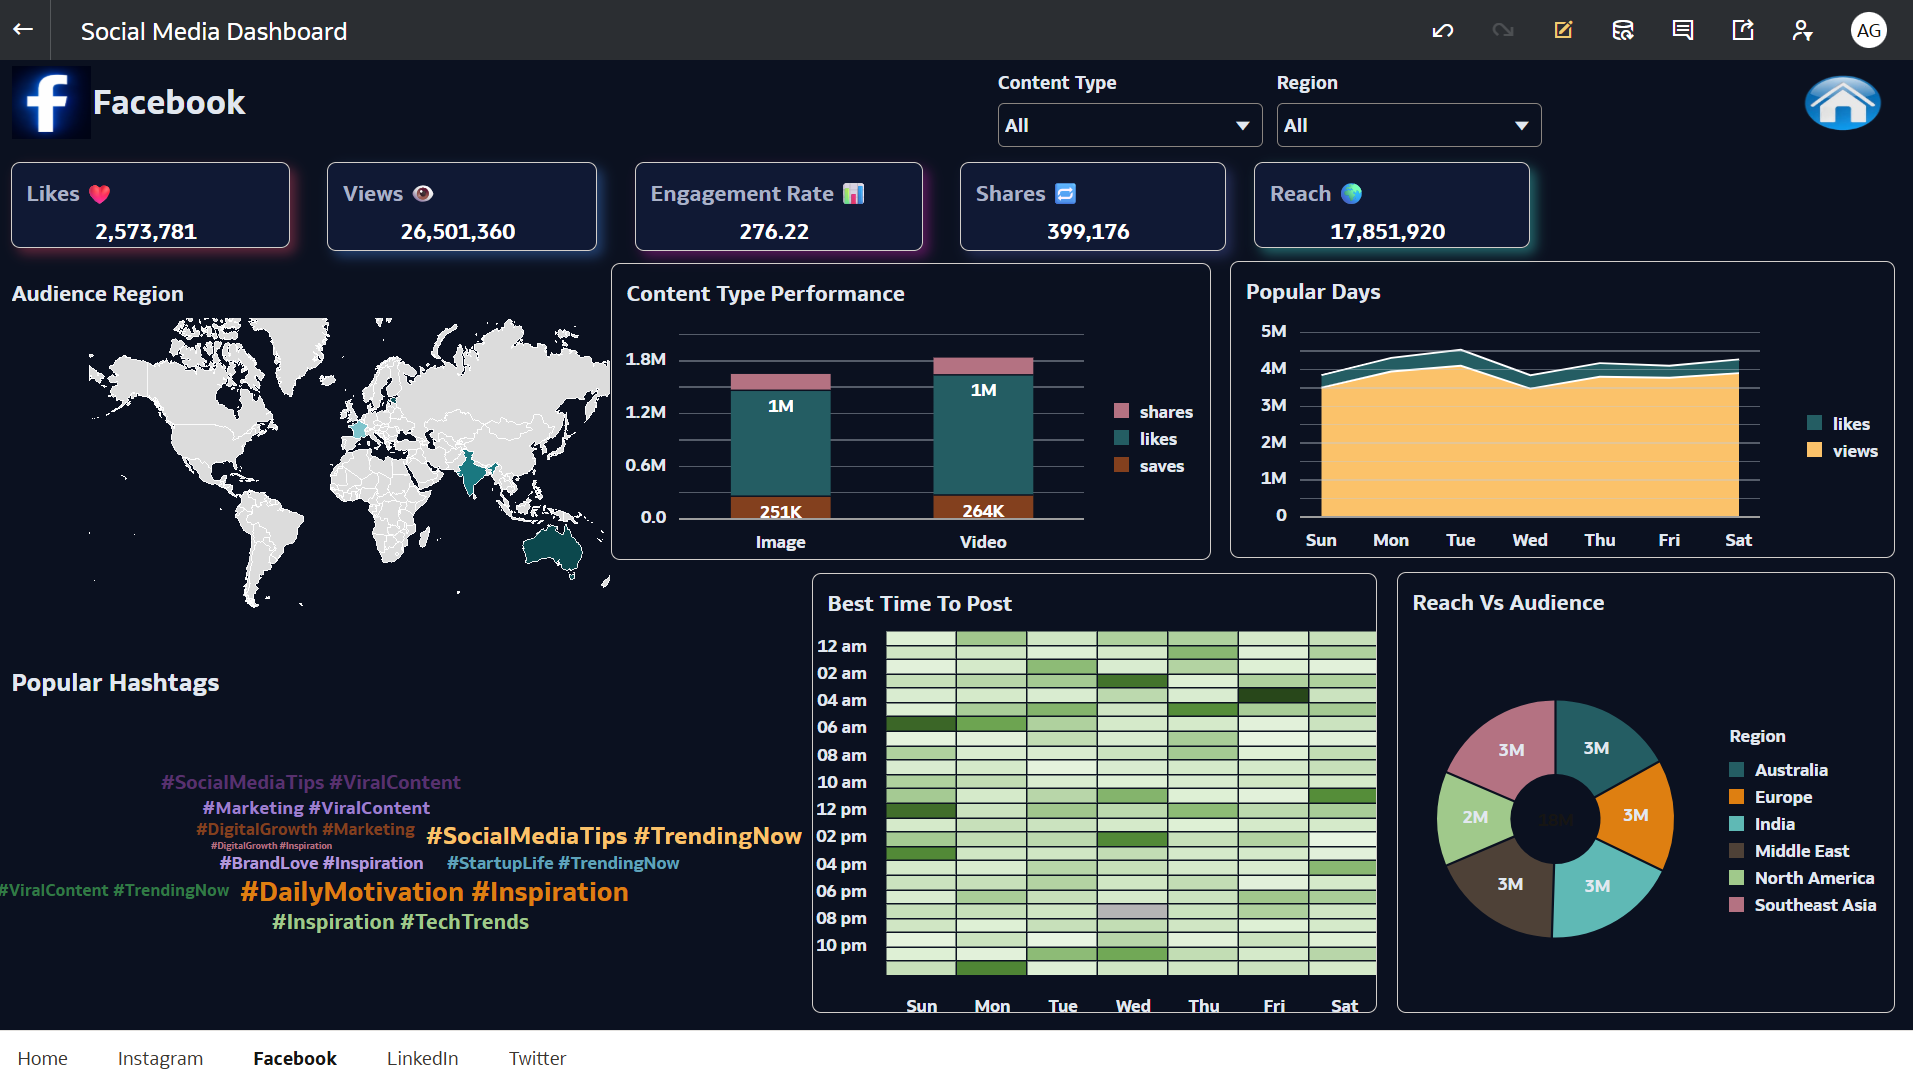
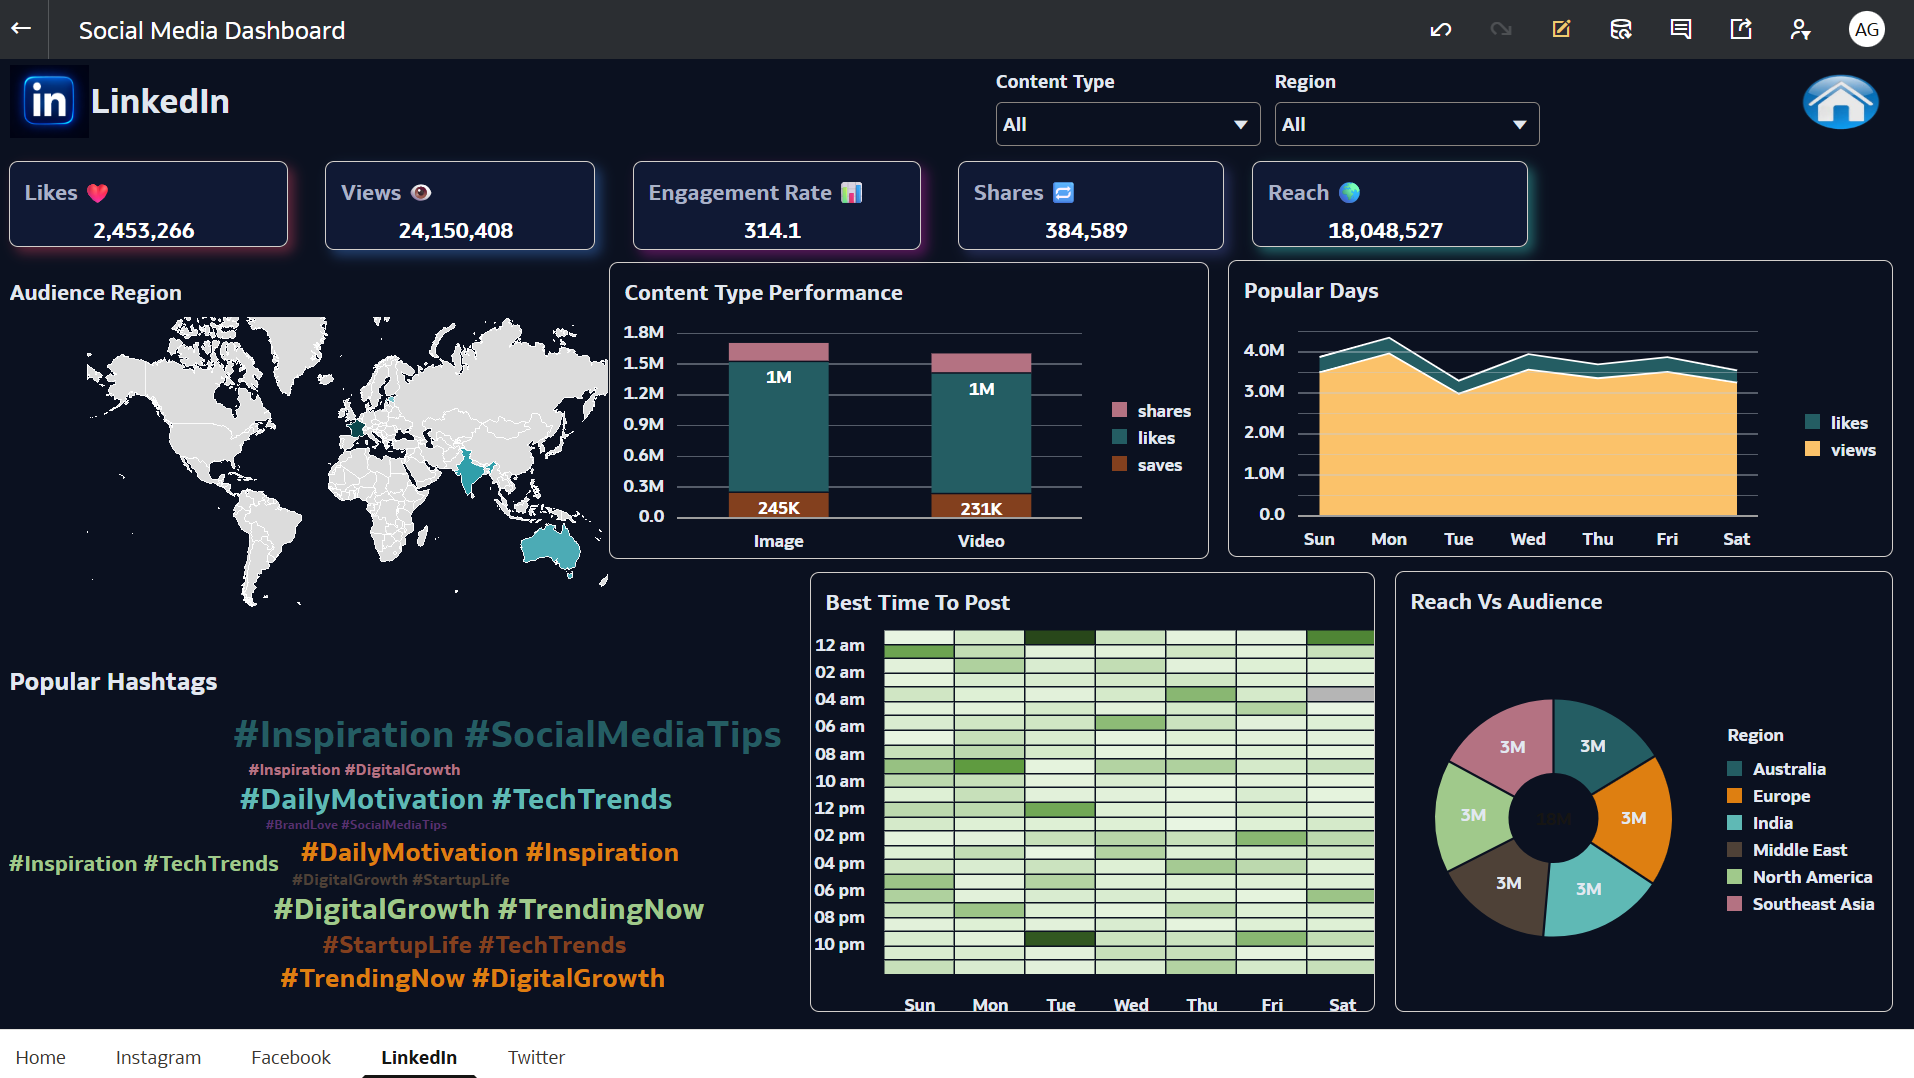
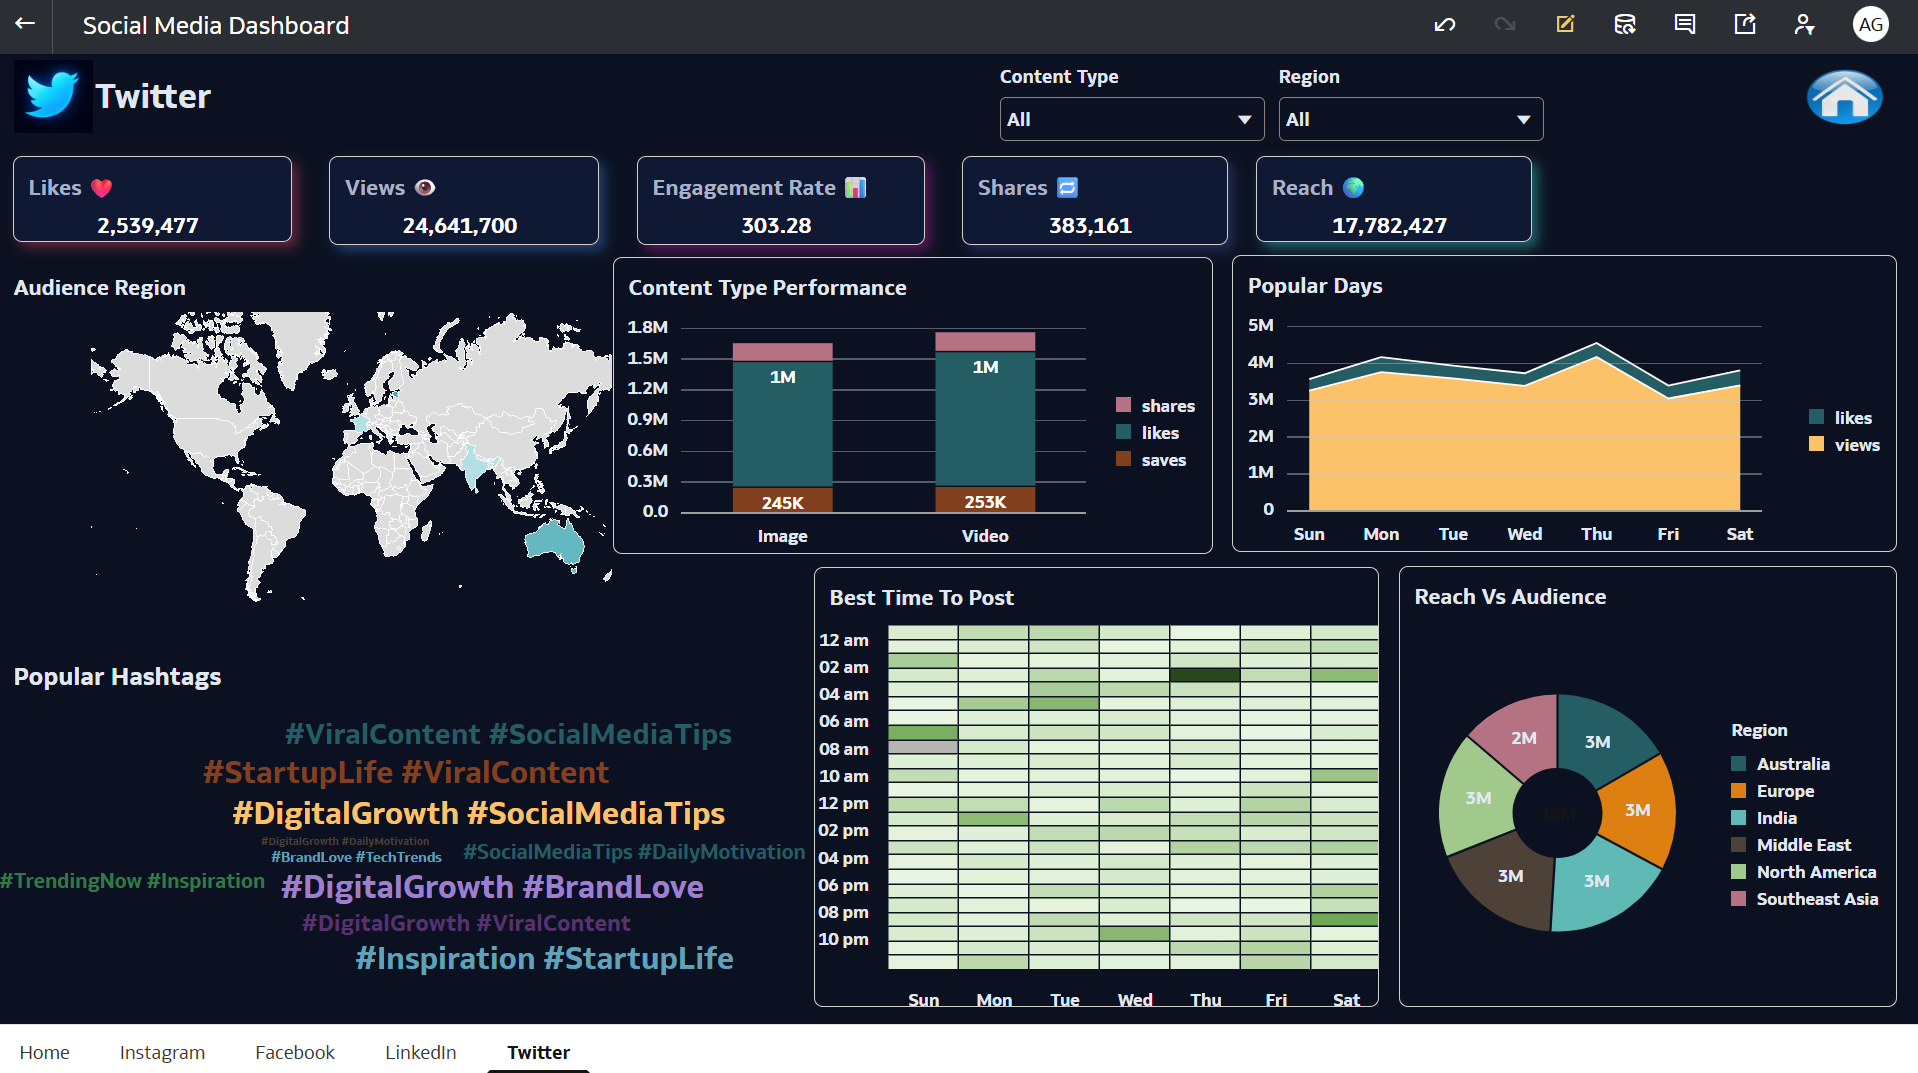
4. What is your visualization about, and what problem does it address?
The visualization focuses on social media performance analysis across multiple platforms and aims to address key business questions such as:
Which platform generates the highest engagement and reach?
What type of content (image, video, etc.) performs best?
Which posts or titles drive maximum likes and interactions?
What is the best time and day to post for higher engagement?
Which regions contribute most to audience reach?
The dashboard provides a comprehensive view of social media effectiveness, combining engagement metrics, content performance, and audience insights.
5. Did you use Oracle Analytics AI features?
Yes, I utilized Oracle Analytics AI capabilities, including:
Explain, to identify key drivers of attrition
Auto Insights and AI Assistant for generating insights, which were further refined and customized
6. Did you upload your visualization image and DVA file?
Yes, I exported and saved:
Dashboard images for presentation purposes
The DVA project file for reuse and demonstration