Oracle Analytics Data Visualization Gallery

Welcome to the Oracle Analytics Community: Please complete your User Profile and upload your Profile Picture

IPD Intelligence Hub — Built with AI, Powered by OAC MCP

Data Visualization
75
Views
1
Comments
Kirk Li
Kirk Li Rank 5 - Community Champion
Discussion thumbnail

post1_arch.png WB_IPD.png WB_IPD (1).png WB_IPD (2).png WB_IPD (3).png

1. Which dataset did you use?

I used a custom dataset named DS_IPD_01, built on a simulated enterprise IPD (Integrated Product Development) database. The dataset contains 7 interconnected tables: Projects, Tasks, Risk_Register, Resource_Allocation, Phase_Gate_Reviews, BOM_Cost, and Monthly_Metrics — covering 10 hardware development projects with 106 columns of operational data.

2. How did you analyze or prepare the data?

Data analysis was fully driven by Claude AI via the OAC MCP (Model Context Protocol). Using the oac-mcp-connect MCP server, Claude autonomously executed a 3-step pipeline:

discover_data → identified available subject areas and datasets

describe_data → retrieved exact column names, data types, and aggregation rules

execute_logical_sql → ran Logical SQL queries against DS_IPD_01 to extract KPIs such as budget variance, gate scores, risk exposure, and phase completion rates

No manual SQL was written. No data was copied to external tools. All insight generation followed a "Methodology-as-Prompt" approach — IPD phase gate methodology was embedded as structured prompts, and Claude translated business questions directly into verified analytics.

3. Who is the intended audience for your visualization?

The primary audience is C-Level executives and PMO leadership (CPO, CFO, Program Directors) overseeing hardware product development portfolios. Secondary audience includes Gate Review committees needing objective, data-driven DCP/DR decision support. The dashboard is designed for 5-minute executive briefings, not deep-dive analysis.

4. What is your visualization about, and what question or problem does it address?

IPD Intelligence Hub is a 5-canvas executive dashboard that transforms raw project data into actionable IPD phase gate intelligence. It addresses the core problem: "Which projects need executive intervention right now, and why?"

The 5 canvases cover:

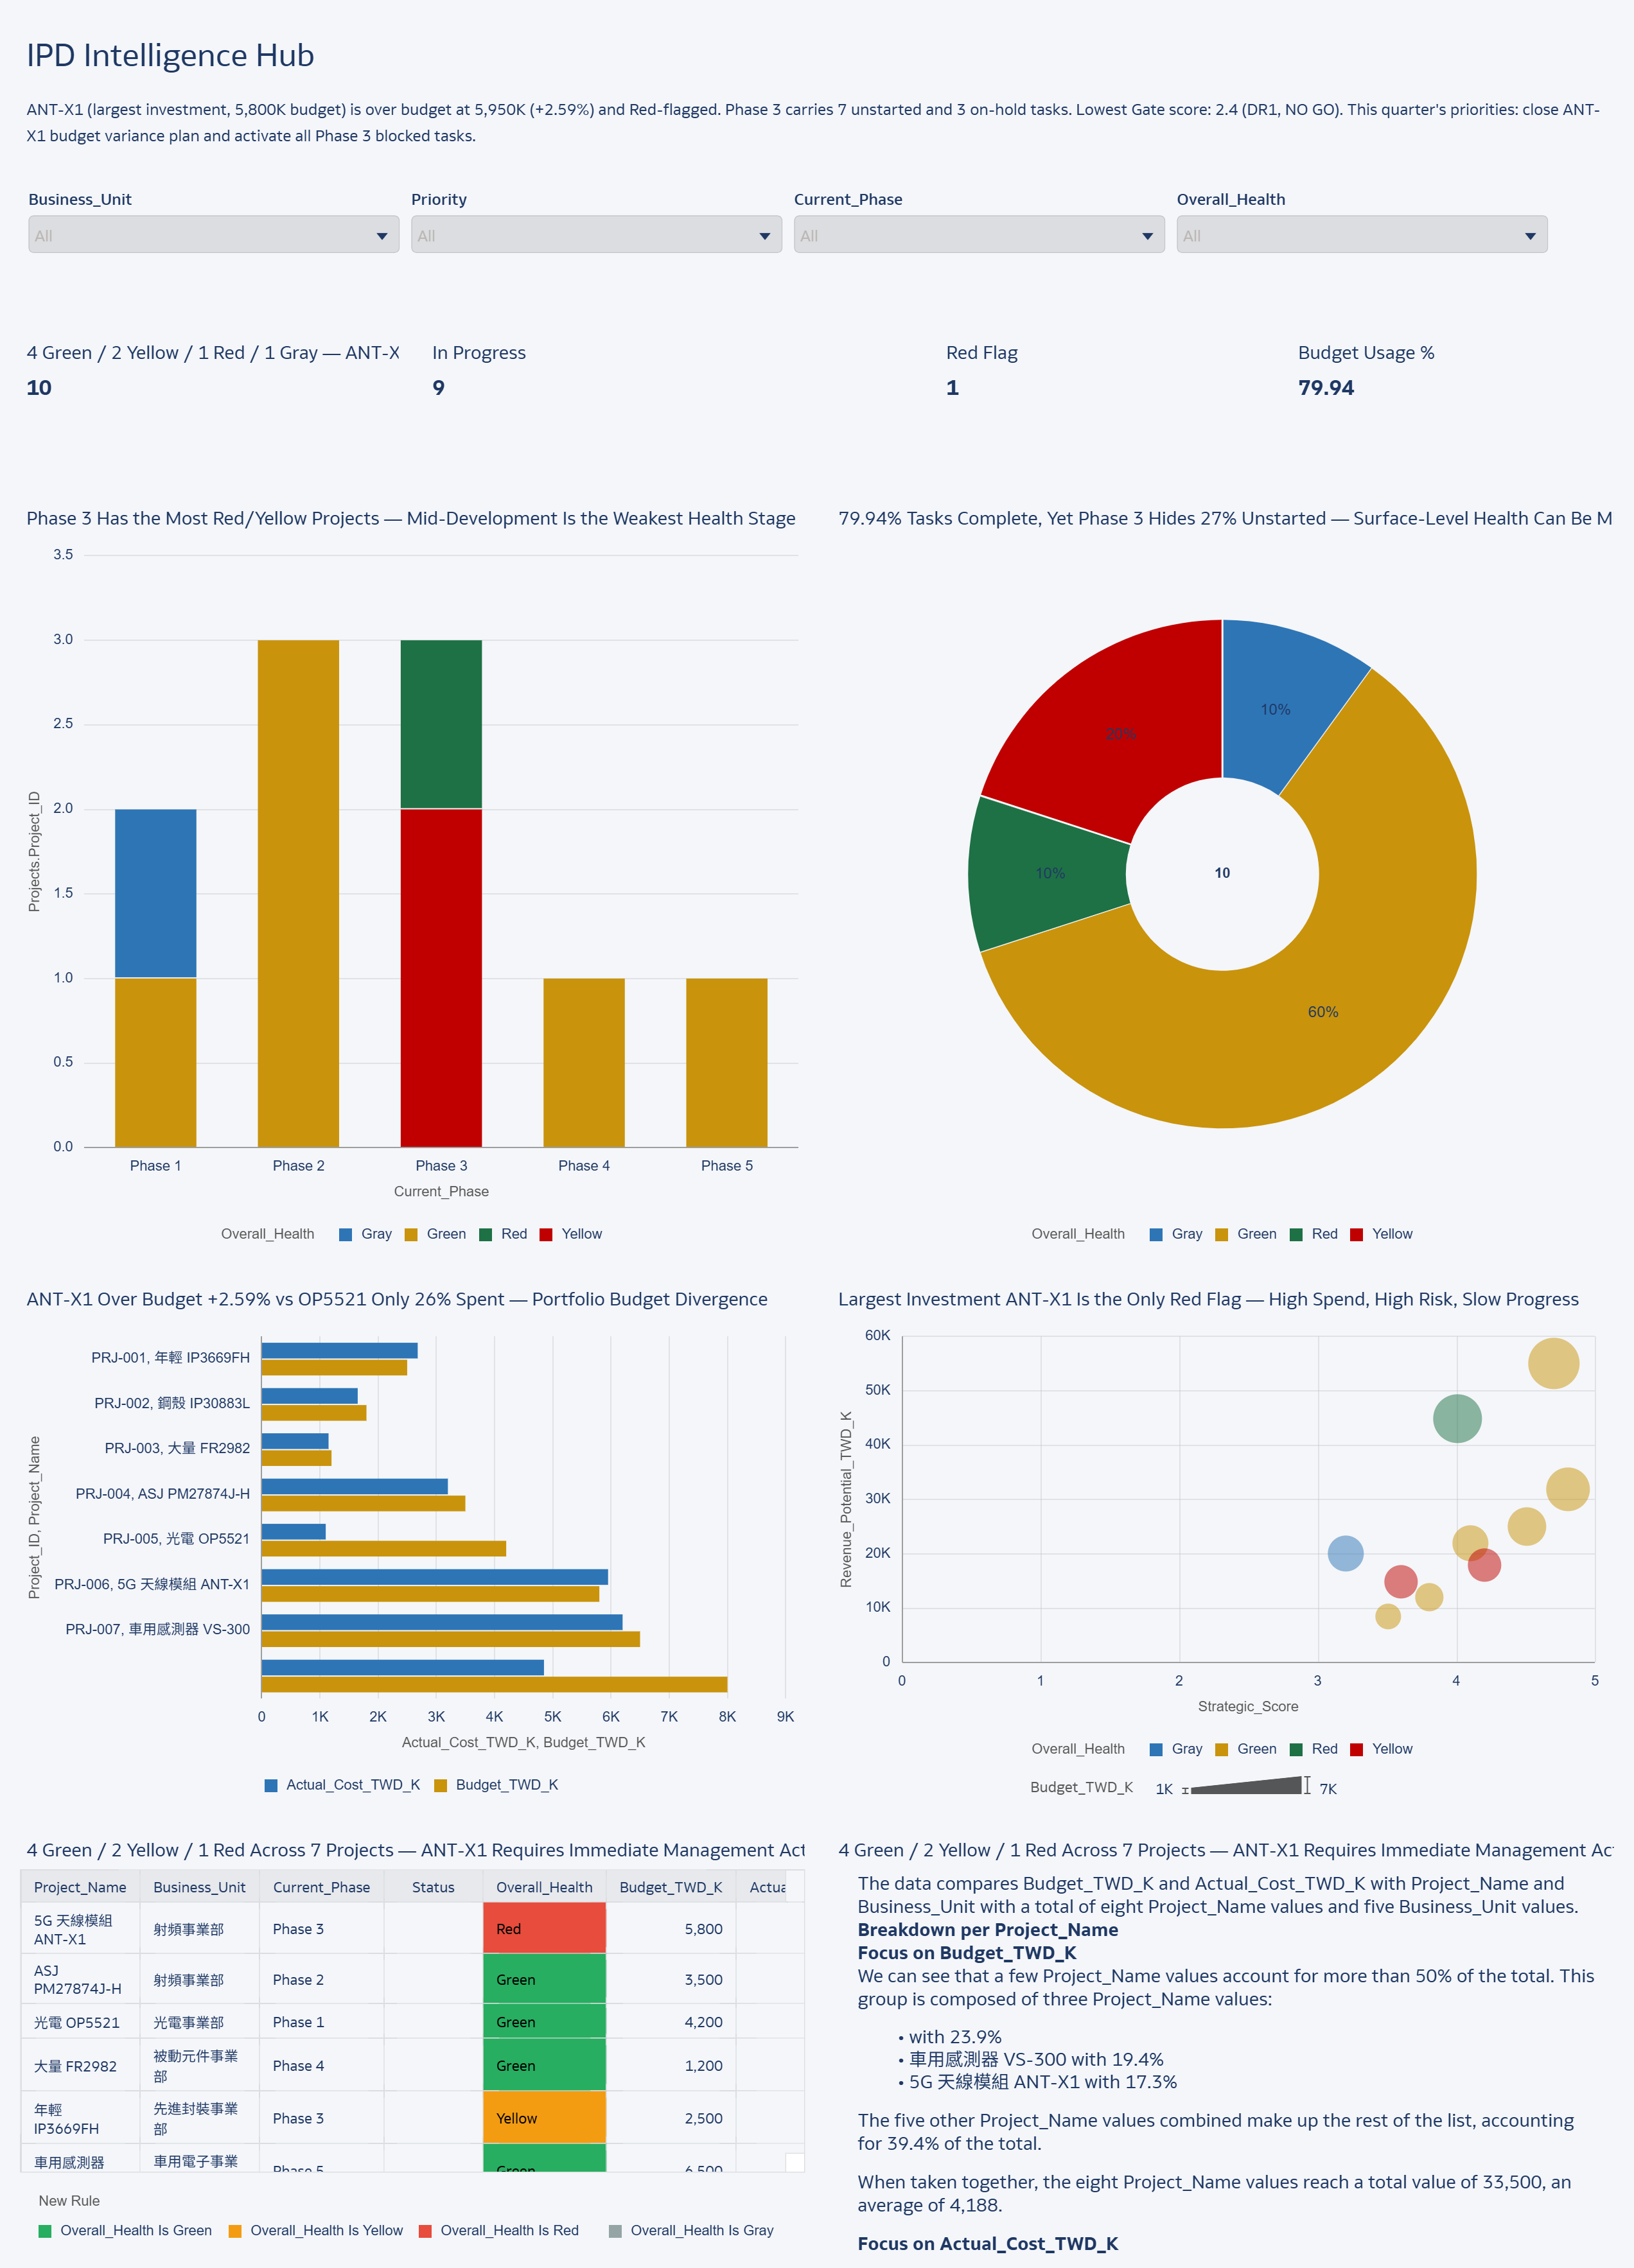
Portfolio Command Center — Budget health, schedule status, phase distribution across 10 projects

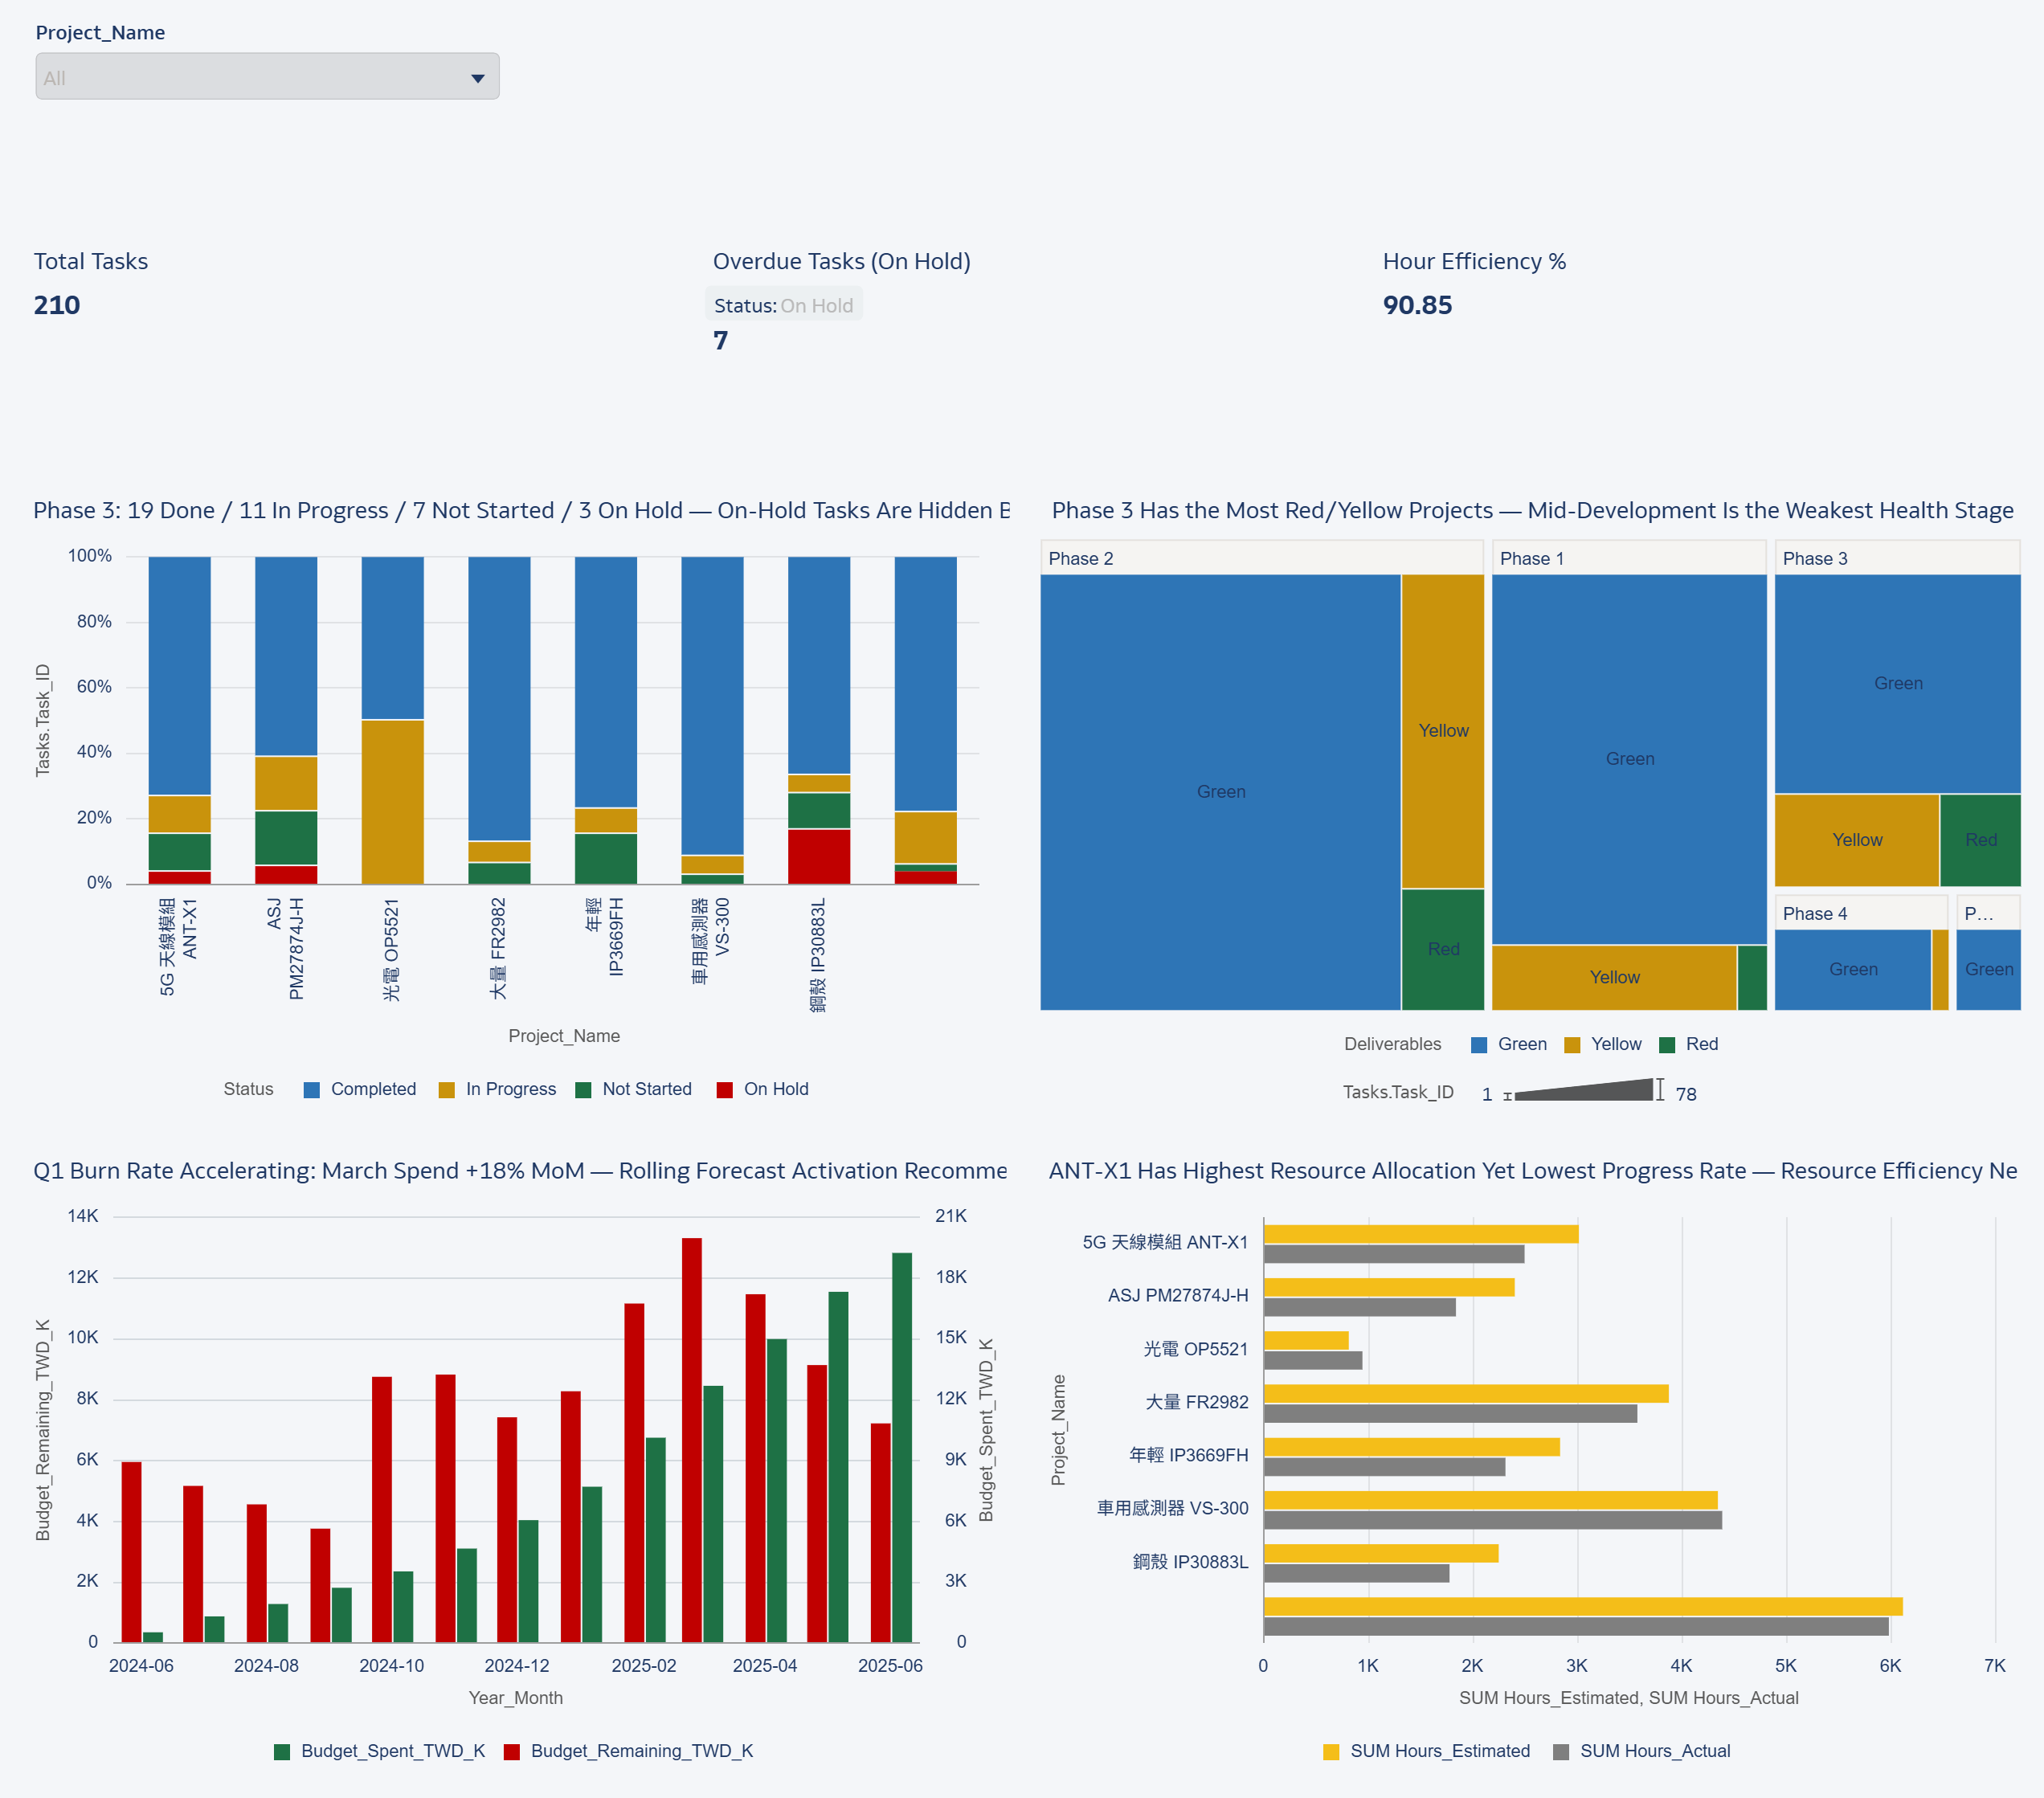
Project Execution Tracker — Task completion by project, resource utilization, monthly burn trends

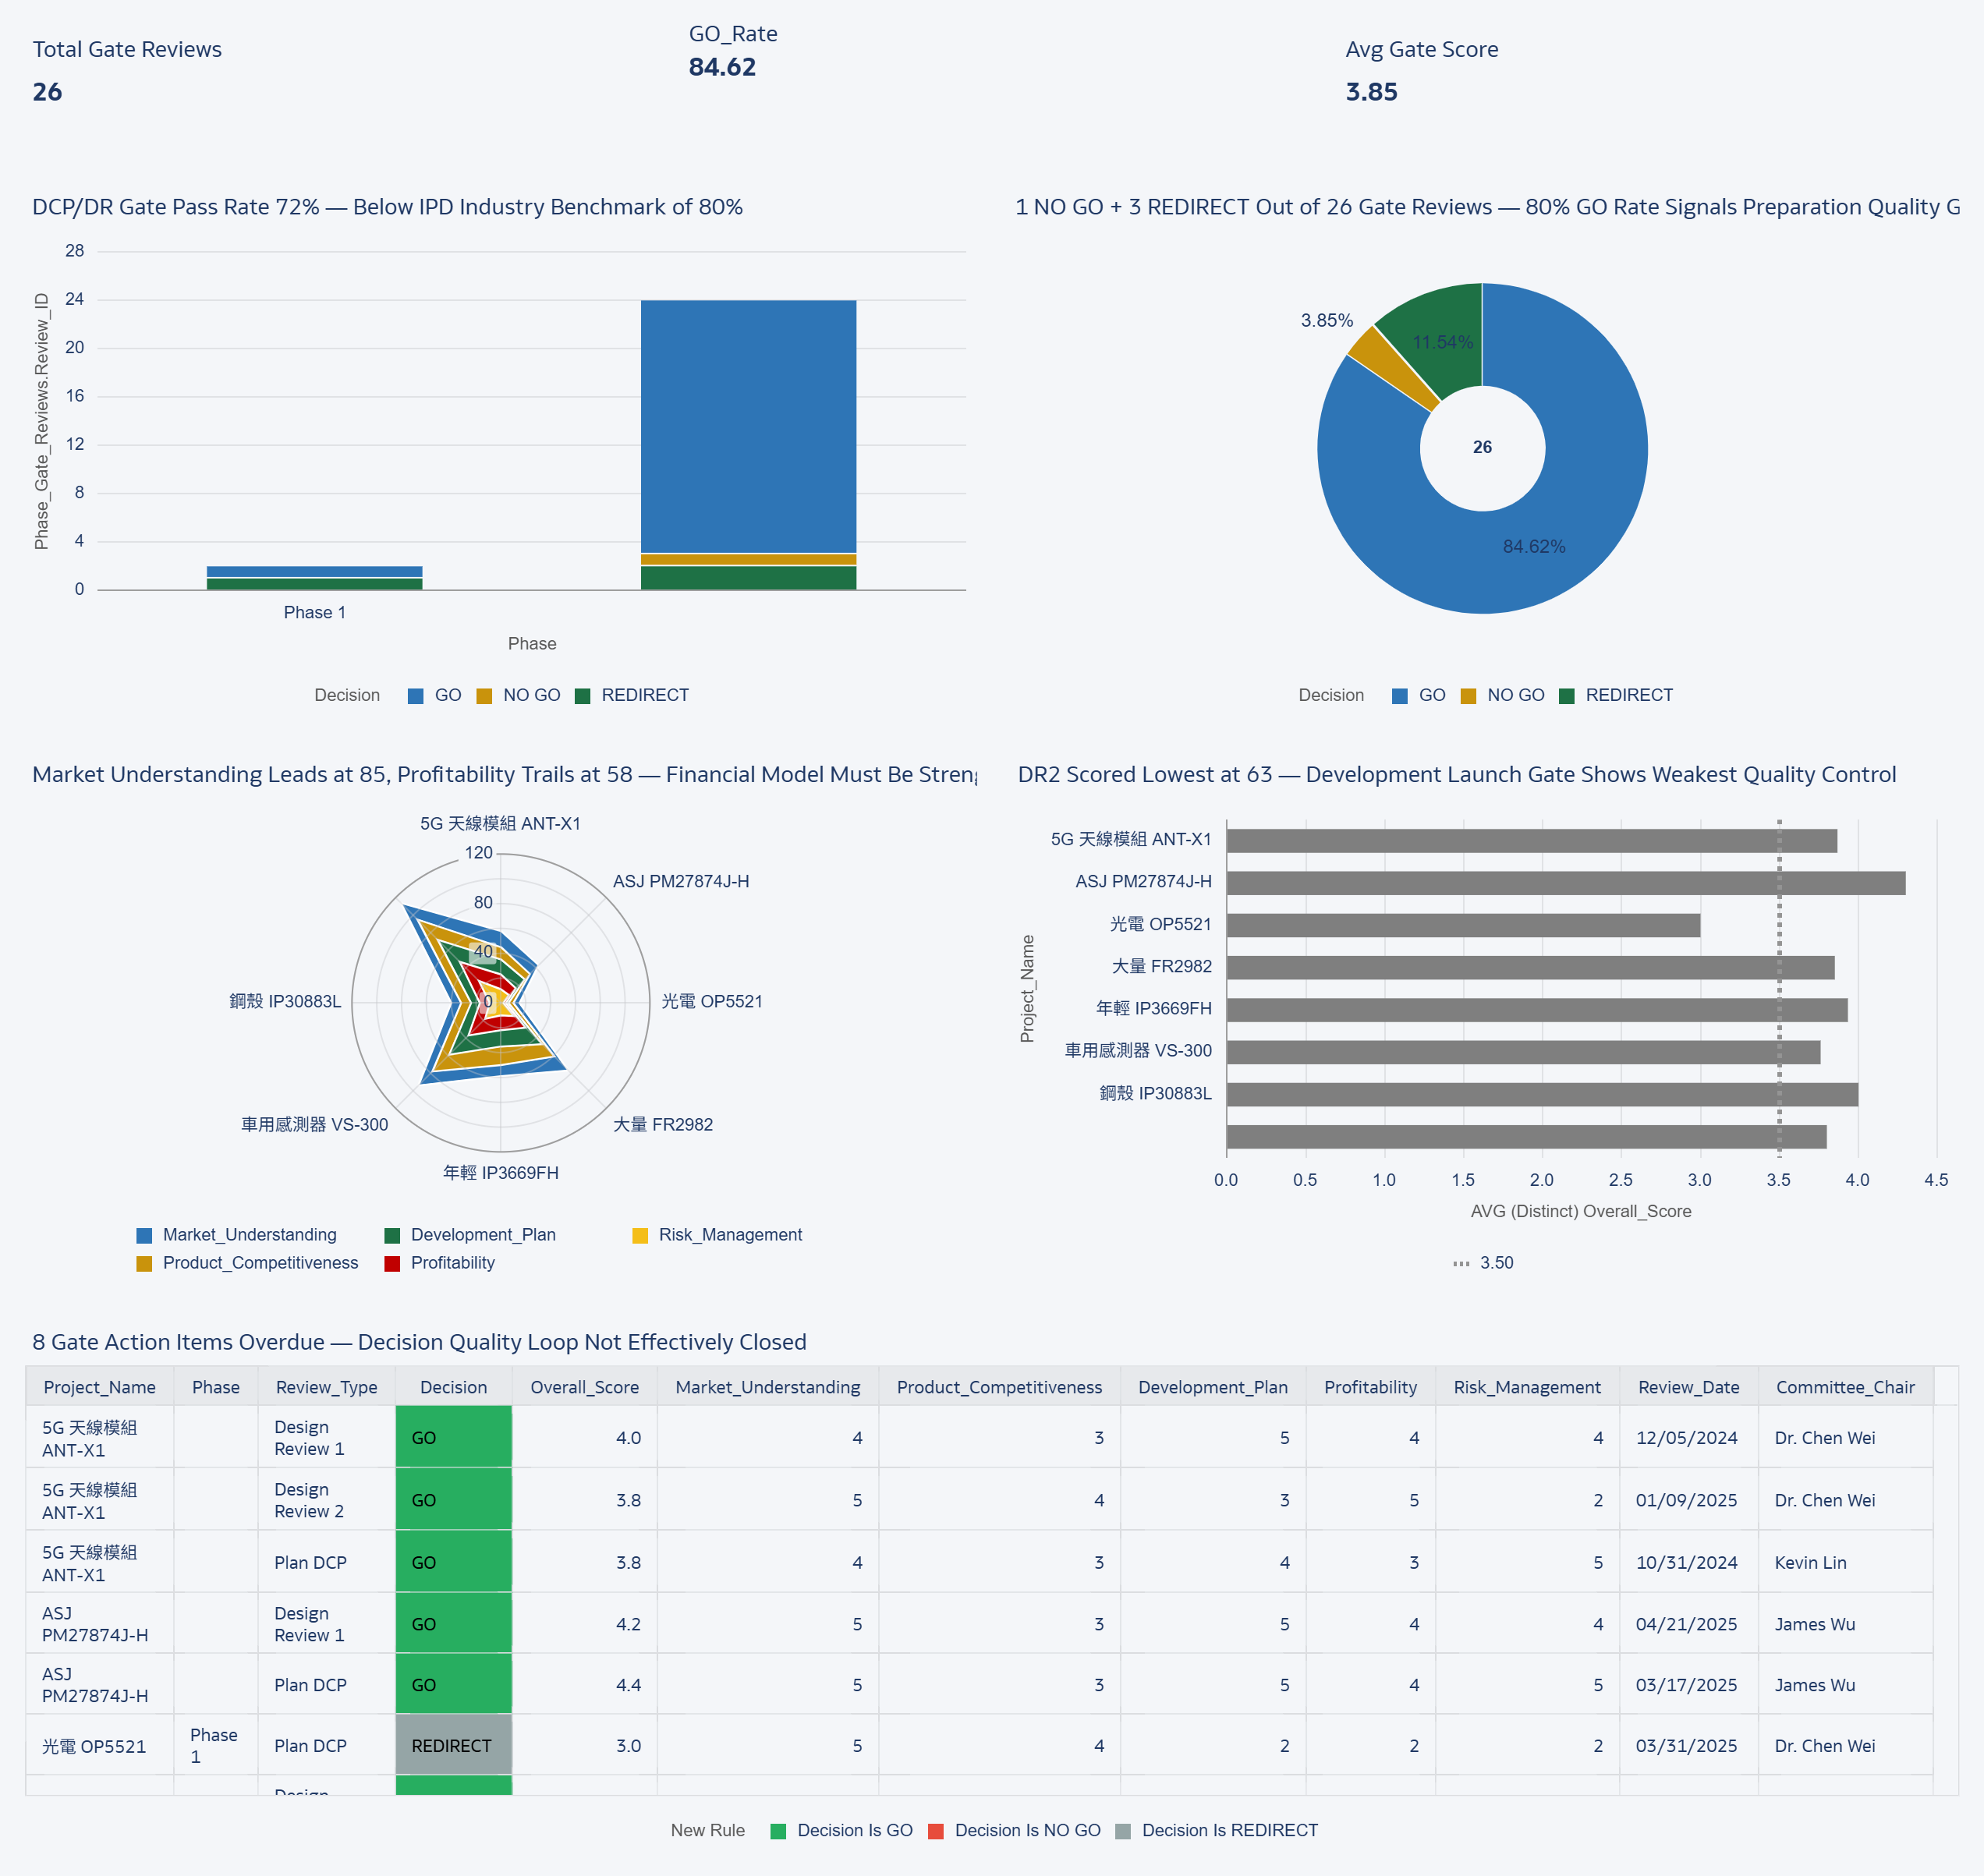
Gate Review Intelligence — Phase gate scores (DR1–DR5), GO/NO-GO/REDIRECT verdicts

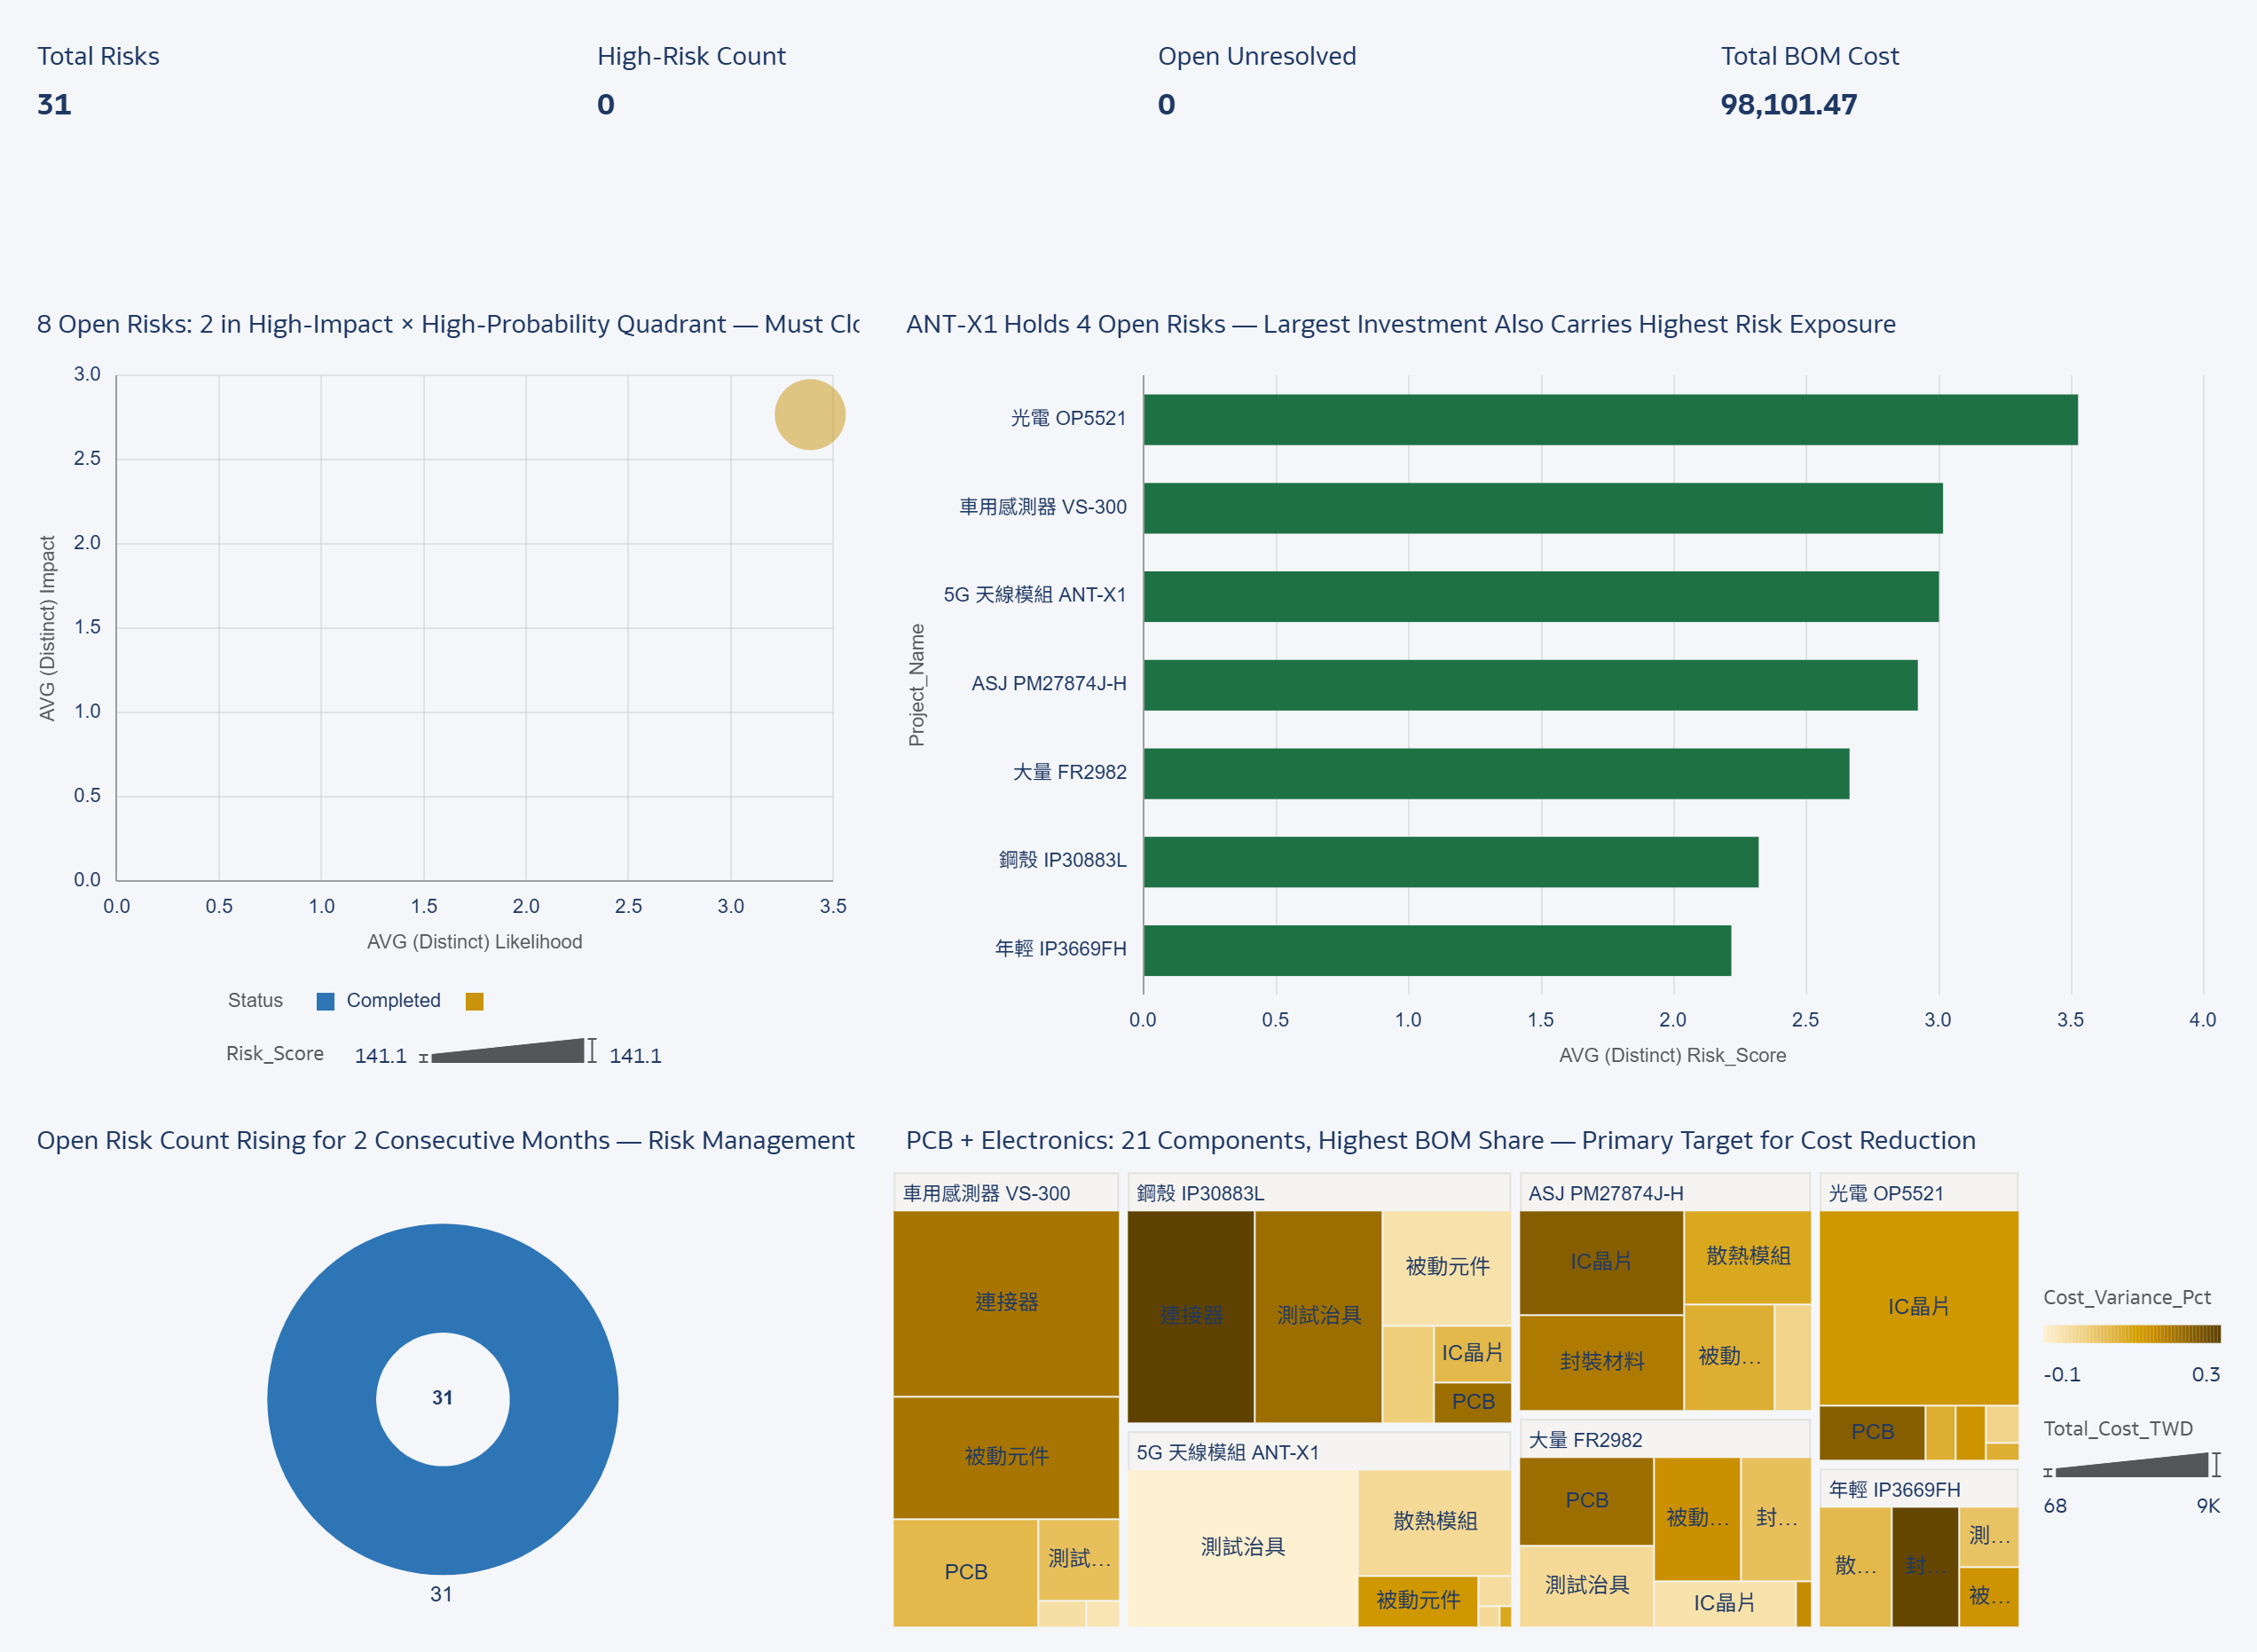
Risk & BOM Command — Risk register heatmap, top BOM cost drivers

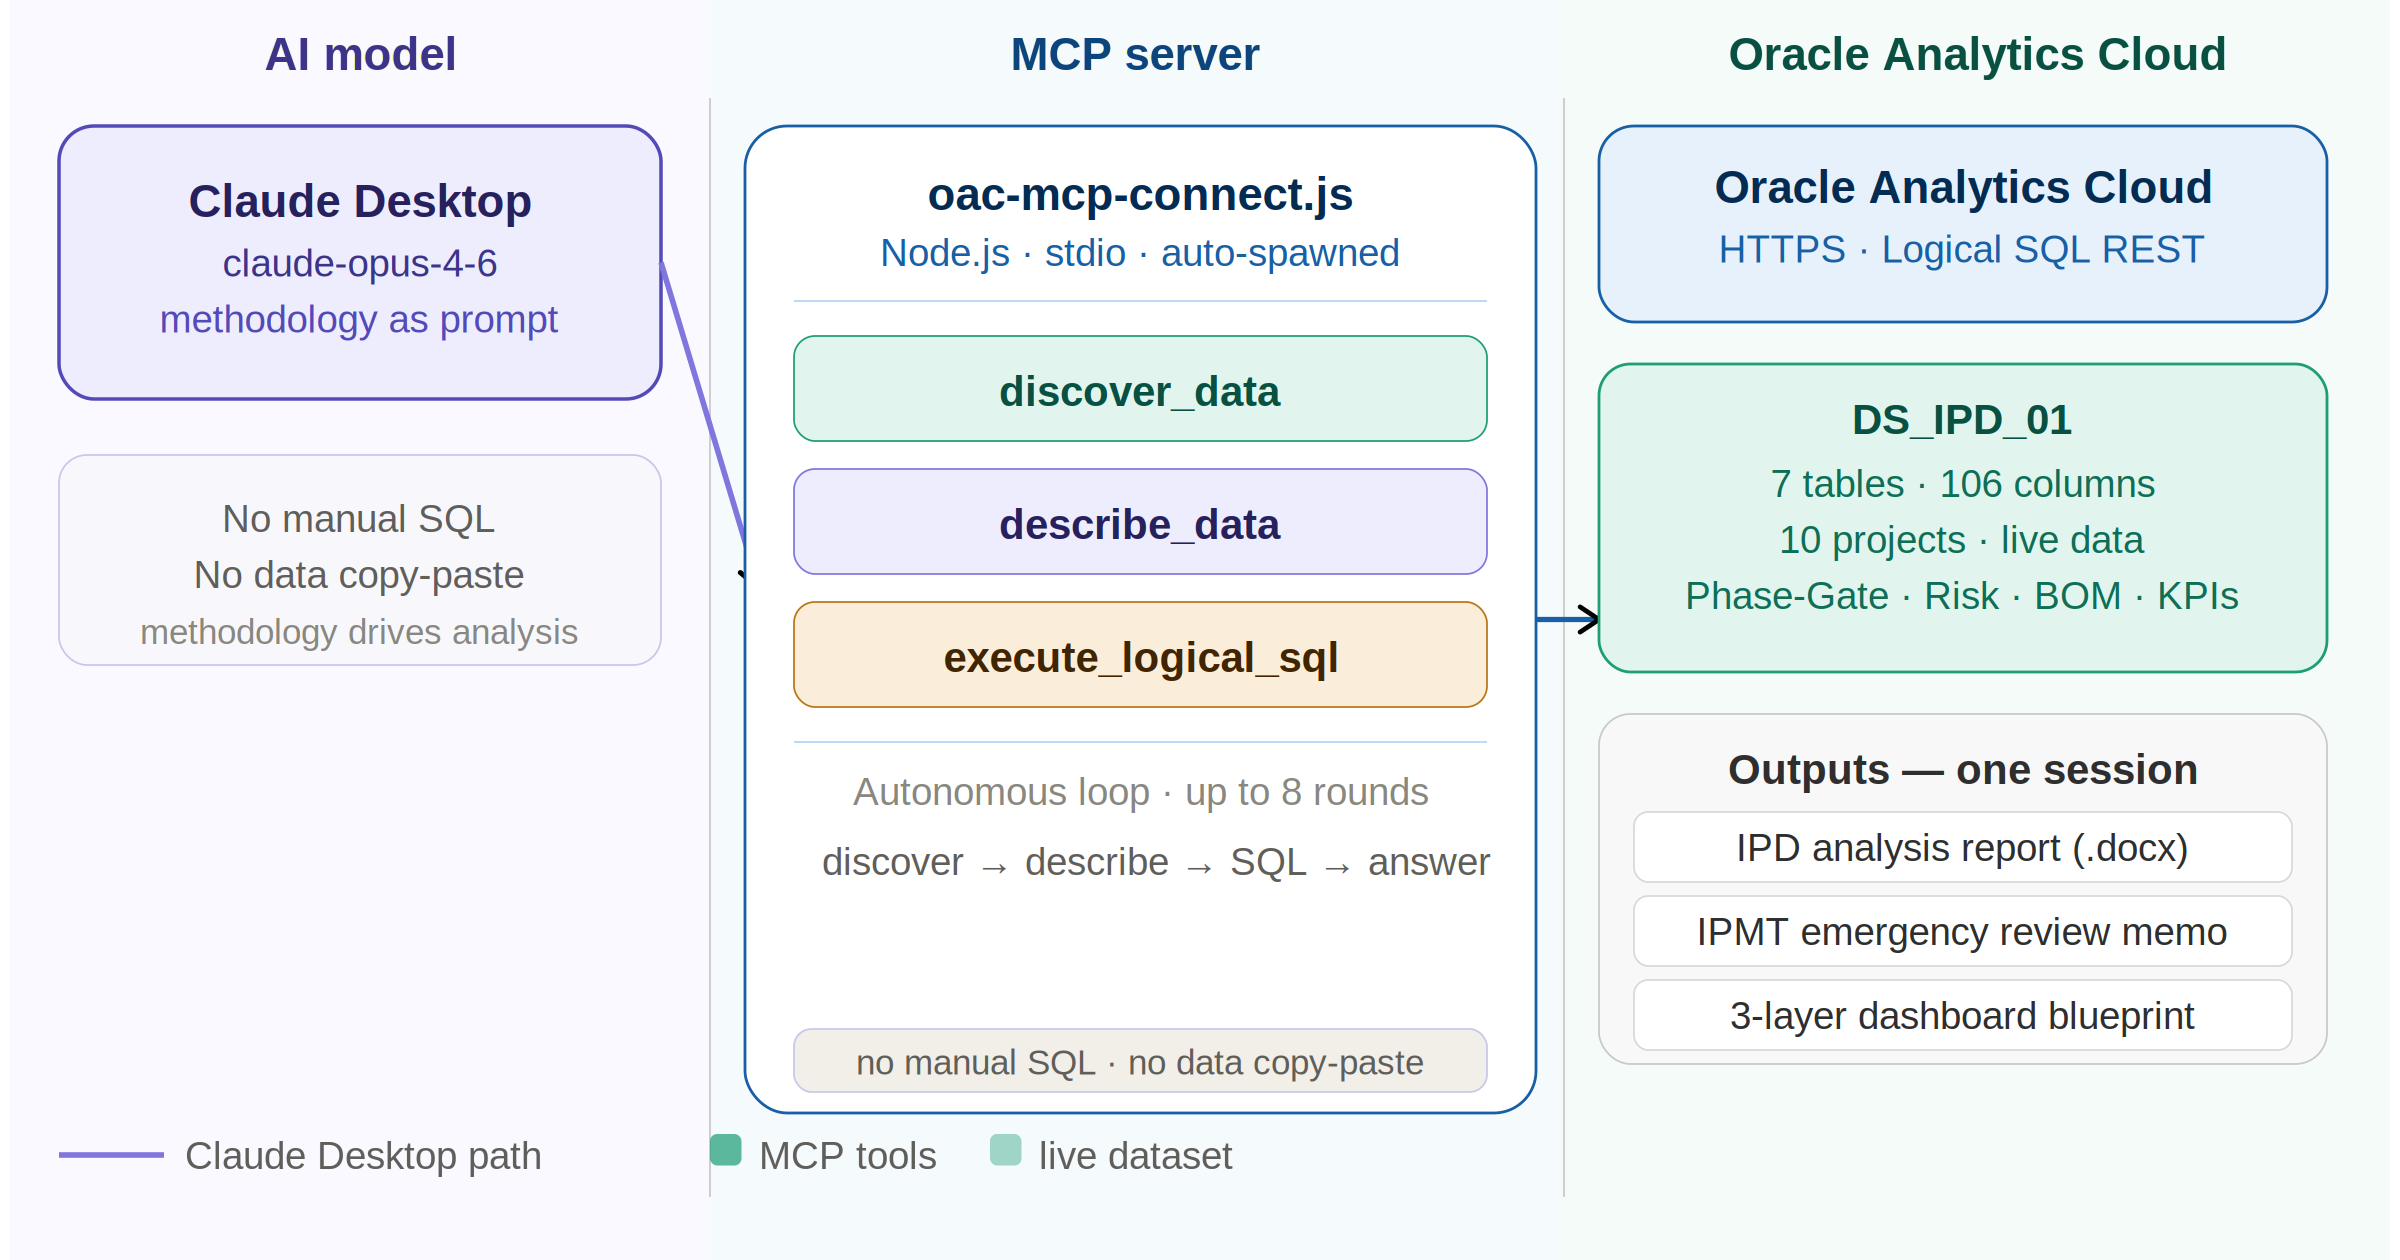
MCP Delivery Notes — Live AI-generated executive narrative powered by Claude + OAC MCP

Key insight surfaced: ANT-X1 shows +2.59% budget overrun at Phase 3 with a DR1 Gate Score of 2.4 (NO GO), requiring immediate escalation.

5. Did you use any Oracle Analytics AI features?

Yes — the most innovative element of this submission is the integration of Claude AI via OAC MCP (Model Context Protocol):

AI Assistant equivalent: Rather than using OAC's built-in AI Assistant, I connected Claude (Anthropic) directly to OAC's data layer through oac-mcp-connect, enabling Claude to query live data, generate insight-led chart titles, and produce an executive narrative — all grounded in real DS_IPD_01 data.

Executive Narrative auto-generation: Canvas 5 (MCP Delivery Notes) displays Claude-generated portfolio commentary, replacing manual report writing.

Methodology-as-Prompt: IPD/DCP-DR methodology was encoded as structured prompts, enabling AI to apply domain expertise without manual intervention.

Interested in On-Premise LLM + MCP with OAC?

This architecture also works with local LLMs (Ollama, Mistral) for air-gapped enterprise deployments — no cloud dependency required.

I'll be posting the full implementation guide on LinkedIn — feel free to connect! 🔗

Cheng En LI | LinkedIn

2
2 votes

Data Visualization · Last Updated

Default status for visualizations

Comments