- 1. Which dataset did you use?
I used a Dummy Cricket Player Performance dataset designed to simulate cricket statistics across different formats such as ODI, T20, and Test matches.
The dataset includes key metrics such as:
Batting performance (Total Runs, Fours, Sixes)
Bowling performance (Wickets)
Match outcomes (Matches Won)
Milestones (Centuries, Half-Centuries)
Strike Rate and performance indicators
Player details (Player Name, Format, Season/Year)
This enables multi-dimensional analysis of player performance across formats and seasons.
2. How did you analyze or prepare the data?
Data preparation and analysis were performed using Oracle Analytics Cloud (OAC). Key steps included:
Data Cleaning & Standardization:
Ensured consistency in player names and match formats
Standardized season/year fields for time-based analysis
Derived Metrics Creation:
Calculated Strike Rate
Aggregated total runs, wickets, and milestones
Created performance KPIs (centuries, half-centuries)
Time-Based Transformations:
Extracted year-wise performance trends
Enabled seasonal comparison of player stats
Aggregation & Validation:
Verified totals (runs, wickets, boundaries)
Ensured correct aggregation across formats
Advanced Structuring:
Grouped data by Format (ODI, T20, Test)
Created hierarchies for Year → Format → Player
3. Who is the intended audience?
This dashboard is designed for:
Cricket Analysts → to evaluate player performance across formats
Team Management & Coaches → to make selection and strategy decisions
Sports Broadcasters & Media → for performance storytelling
Fans & Enthusiasts → to explore player statistics interactively
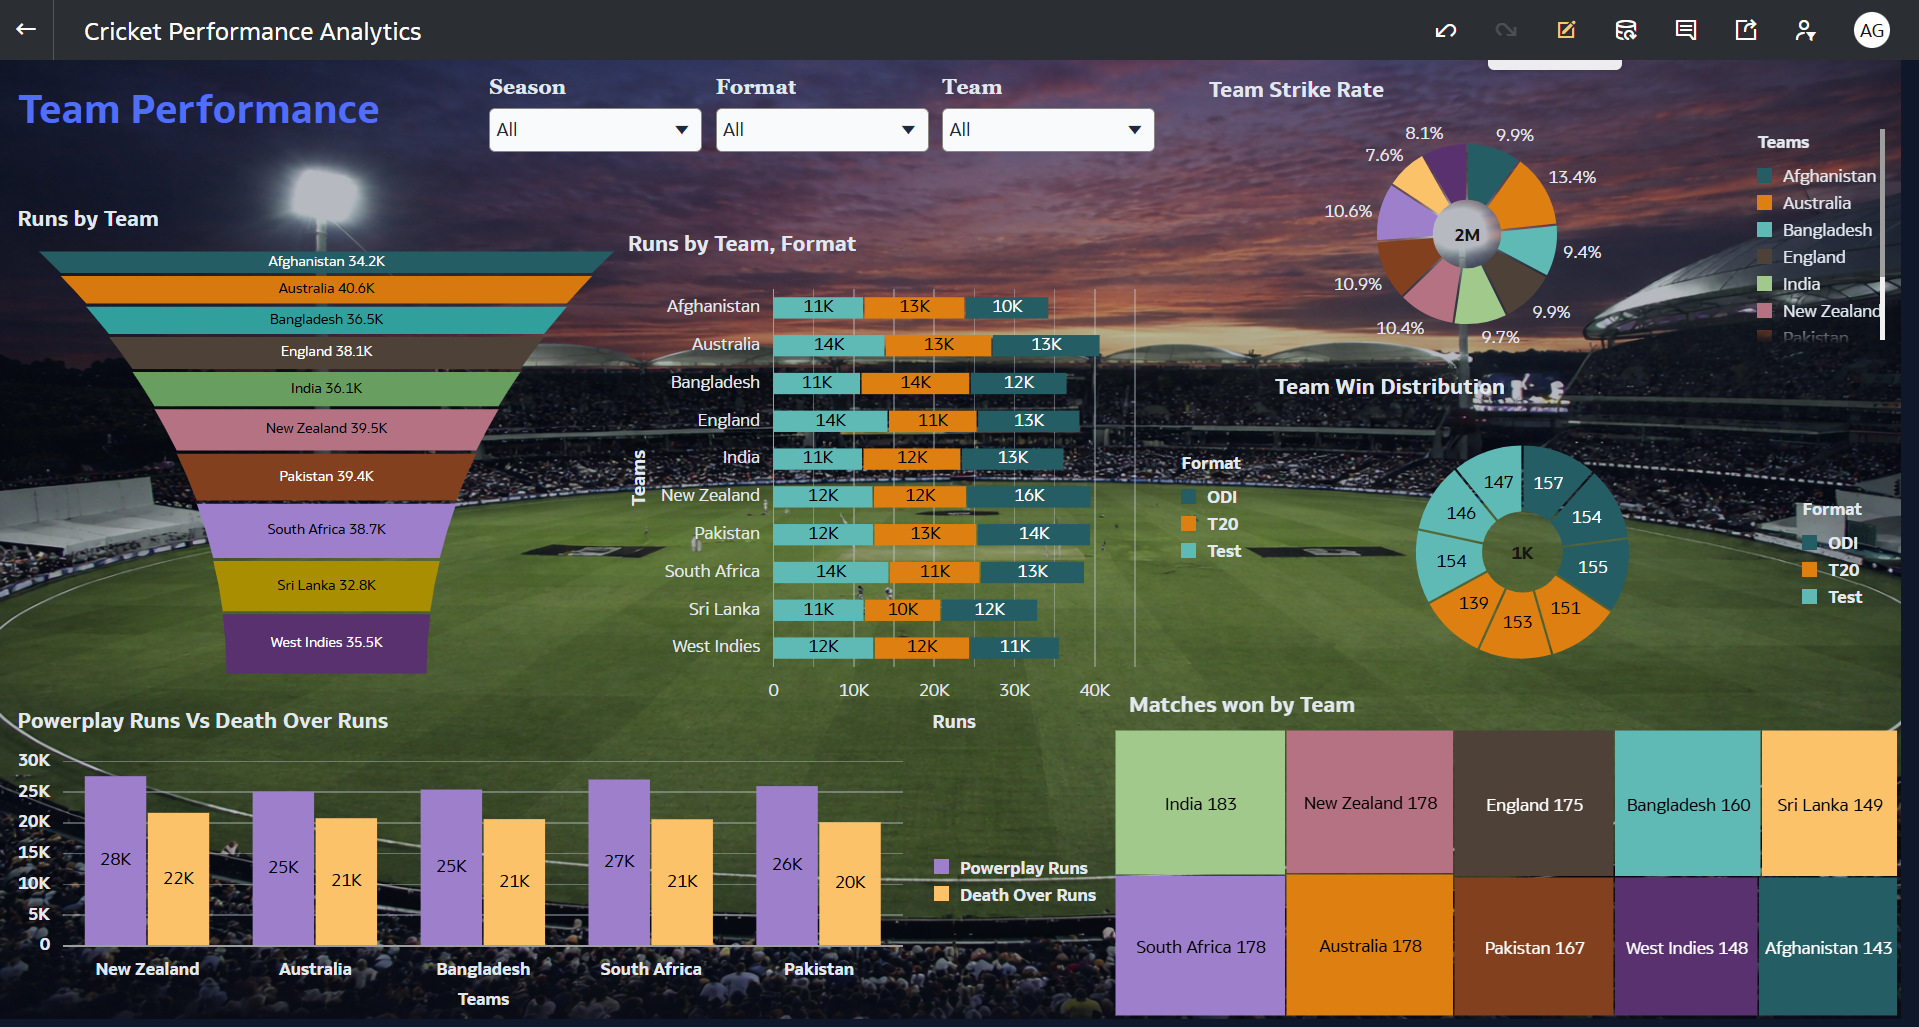
4. What is your visualization about, and what problem does it address?
The visualization focuses on cricket player performance analysis and addresses key questions such as:
How does a player perform across different formats (ODI, T20, Test)?
What are the player’s strengths (runs, strike rate, boundaries)?
How consistent is the player across seasons?
How many milestones (100s, 50s) has the player achieved yearly?
What is the contribution of each format to overall performance?
The dashboard provides a comprehensive performance overview, helping stakeholders understand player consistency, strengths, and trends over time.
5. Did you use Oracle Analytics AI features?
Yes, I utilized Oracle Analytics AI capabilities, including:
Explain → to identify key drivers behind performance metrics
Auto Insights → to detect trends in runs, strike rate, and milestones
AI Assistant → to generate insights and refine dashboard queries
Yes, I have:
Exported dashboard images for presentation
Saved and shared the DVA project file for reuse and demonstration