Which dataset did you use?
I used a synthetically generated server utilization and application performance dataset designed to simulate real-world IT operations. The dataset contains ~5,000 records with 5-minute granularity across 14 servers and 10 applications.
It includes:
- Infrastructure metrics (CPU, memory, disk, network)
- Application metrics (response time, request count, error rate)
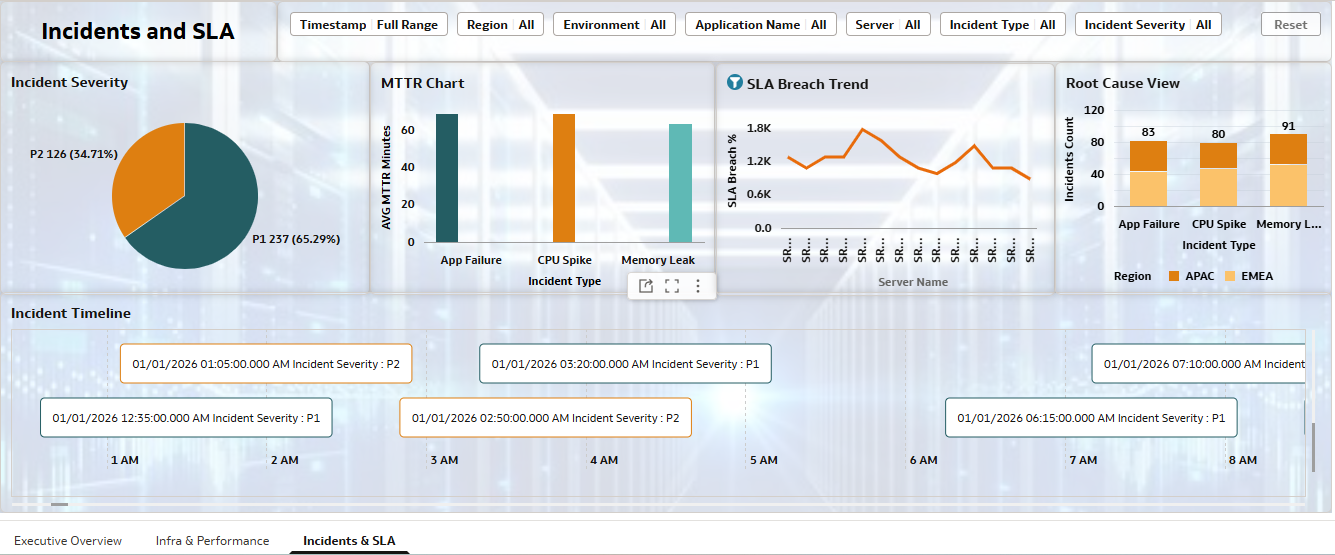
- Incident data (incident type, severity, MTTR)
- SLA tracking (
sla_breach_flag) - Alert classifications (OK, WARNING, CRITICAL)
This dataset was specifically created to support advanced analytics in Oracle Analytics Cloud.
How did you analyze or prepare the data?
The dataset was programmatically generated and enriched with:
- Realistic workload patterns using statistical distributions
- Injected anomalies (CPU spikes, memory leaks, application failures)
- Correlated metrics (e.g., high CPU → increased response time → higher error rate)
- Derived fields such as:
- SLA breach flag
- Alert levels
- Time attributes (hour of day, weekday/weekend)
Within Oracle Analytics Cloud, additional calculations were created:
- SLA Breach %
- Critical alert counts
- Availability metrics
- MTTR aggregations
Who is the intended audience for your visualization?
The dashboard is designed for:
- IT Operations Teams
- Site Reliability Engineers (SREs)
- Infrastructure & Application Support Teams
- IT Leadership / Operations Managers
It provides both technical insights and business-level visibility (SLA impact).
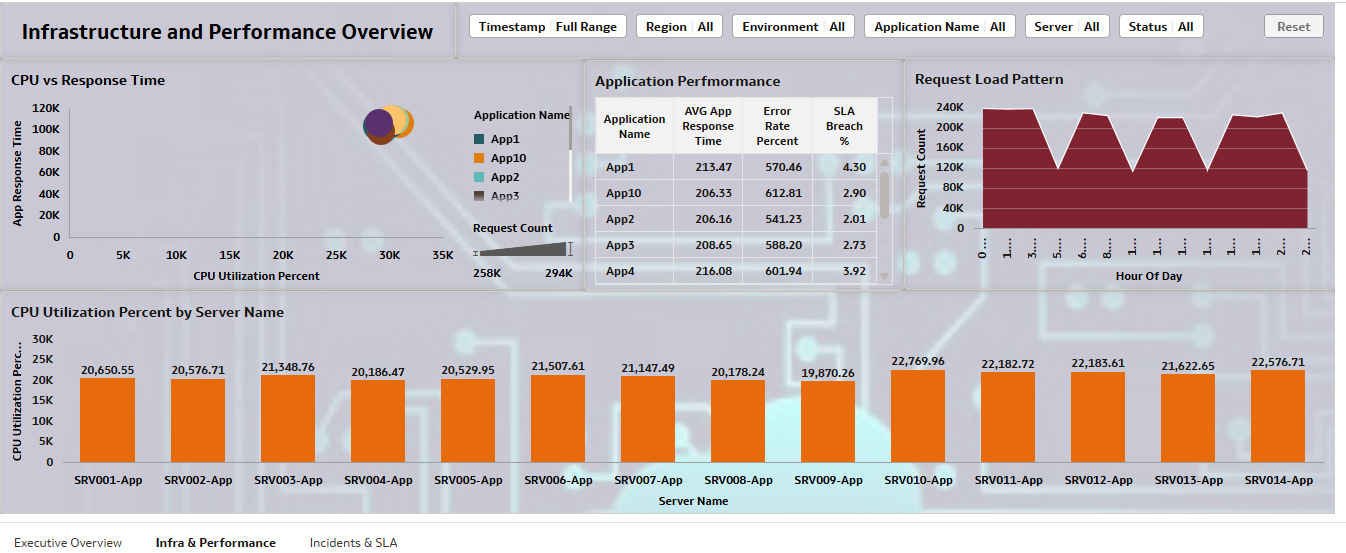
What is your visualization about, and what problem does it address?
The visualization focuses on end-to-end system observability, combining infrastructure performance, application behavior, and incident management.
It addresses key questions such as:
- Are systems operating within acceptable performance limits?
- What causes performance degradation (infrastructure vs application)?
- Where are SLA breaches occurring and why?
- How quickly are incidents being resolved (MTTR)?
- Which servers or applications are high-risk?
The dashboard enables proactive monitoring, root cause analysis, and SLA compliance tracking.
Did you use any Oracle Analytics AI features?
Yes, I leveraged AI-assisted capabilities in Oracle Analytics Cloud:
- AI Assistant (Natural Language Query)
Used to quickly generate initial visualizations such as:- “CPU utilization over time”
- “SLA breach percentage by application”
- Auto Insights / Explain Feature
Helped identify key drivers behind:- High response time
- SLA breaches
- Smart Suggestions
Assisted in selecting optimal chart types and highlighting trends/anomalies
These features accelerated dashboard development and improved insight discovery.
Did you upload your visualization image and DVA file?
Yes, Dashboard screenshots were exported and shared
The DVA (Data Visualization Archive) file was uploaded for reuse and reproducibility
