See our latest Data Visualization audit here for more information.
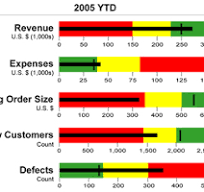
Bullet Graphs:
https://www.perceptualedge.com/articles/misc/Bullet_Graph_Design_Spec.pdf
Pareto chart will be great to have!
Similar to others, I'd like to see all of them. I voted for Funnel and would also like to see Gant, Org and Map enhancements
Explore how to build agents using code in AI Data Platform. We'll create an agent that examines and analyzes the contents of a Github repository and reports its findings. The session demonstrates how to use different developer tools to create agents including the AIDP extension for VS Code and Codex. Using these tools we…
Agenda Presentation: Optimize FDI Workbook Performance Learn best practices and optimization strategies for building performant workbooks in Oracle FDI. We’ll share practical tips and lessons learned to help report authors avoid common pitfalls and design workbooks with performance in mind from the start. As a special…
Learn how to deploy an AI Data Platform agent, register it to the AI Registry, and introduce it to business users through Agent Hub. This session covers how to prepare an agent for deployment, configure endpoint access and authentication, invoke a deployed agent, and monitor it after deployment. The session also introduces…