This dashboard was featured in the Data Visualization Optimization webinar on Wednesday, September 10th, 2025. Register for the recurring series here. If you have questions about the features displayed during this webinar please post them below!
Special thanks goes to @Caroline Blanchard and the Baylor University team for letting us feature their workbook and members of the Oracle Design team: @Sarahi Romero-Oracle (Sarahi Tenorio), John Fuller, and Scott Ichikawa.
DVA:
View this workbook in consumer mode on OAC Public. Note that there are some differences in this public dashboard from the final version since the OAC Public instance is not yet on the September 2025 release
Open this workbook in your own instance:
Webinar Replay:
Watch a recording of the webinar here:
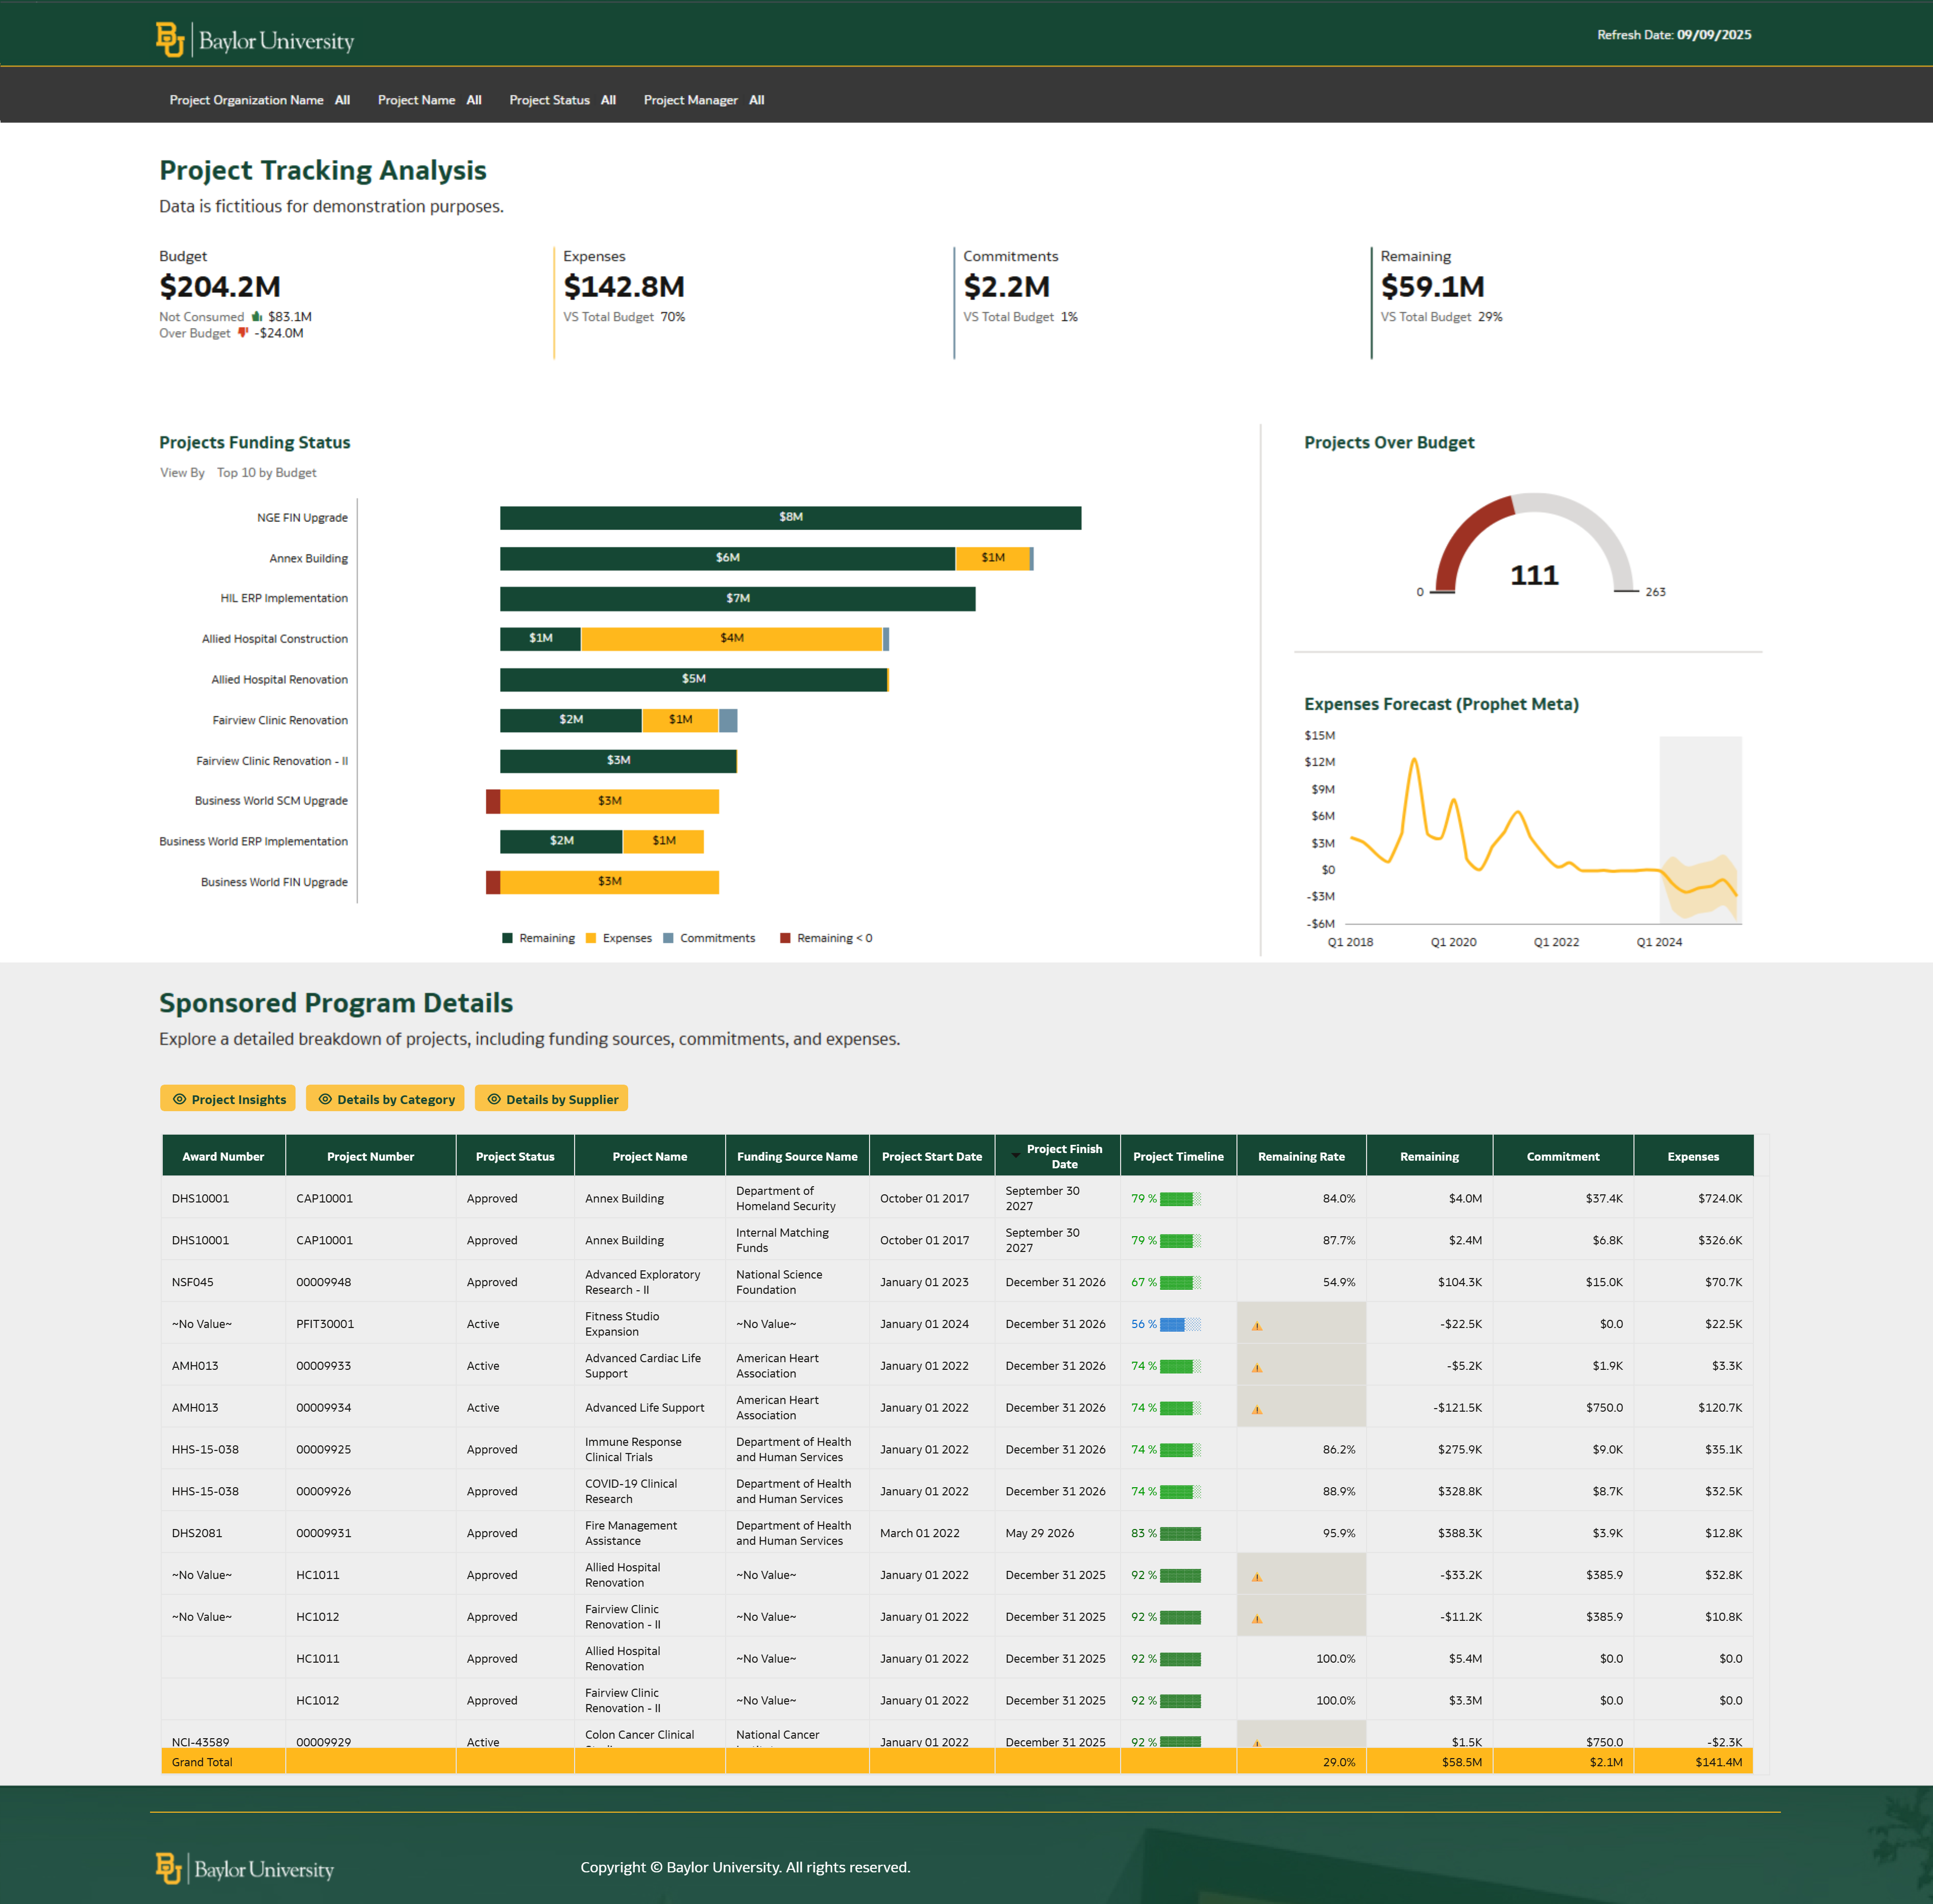
Optimized Dashboard:
Note that data is fictional for demonstration purposes.
Note that data is fictional for demonstration purposes.
Original Dashboard
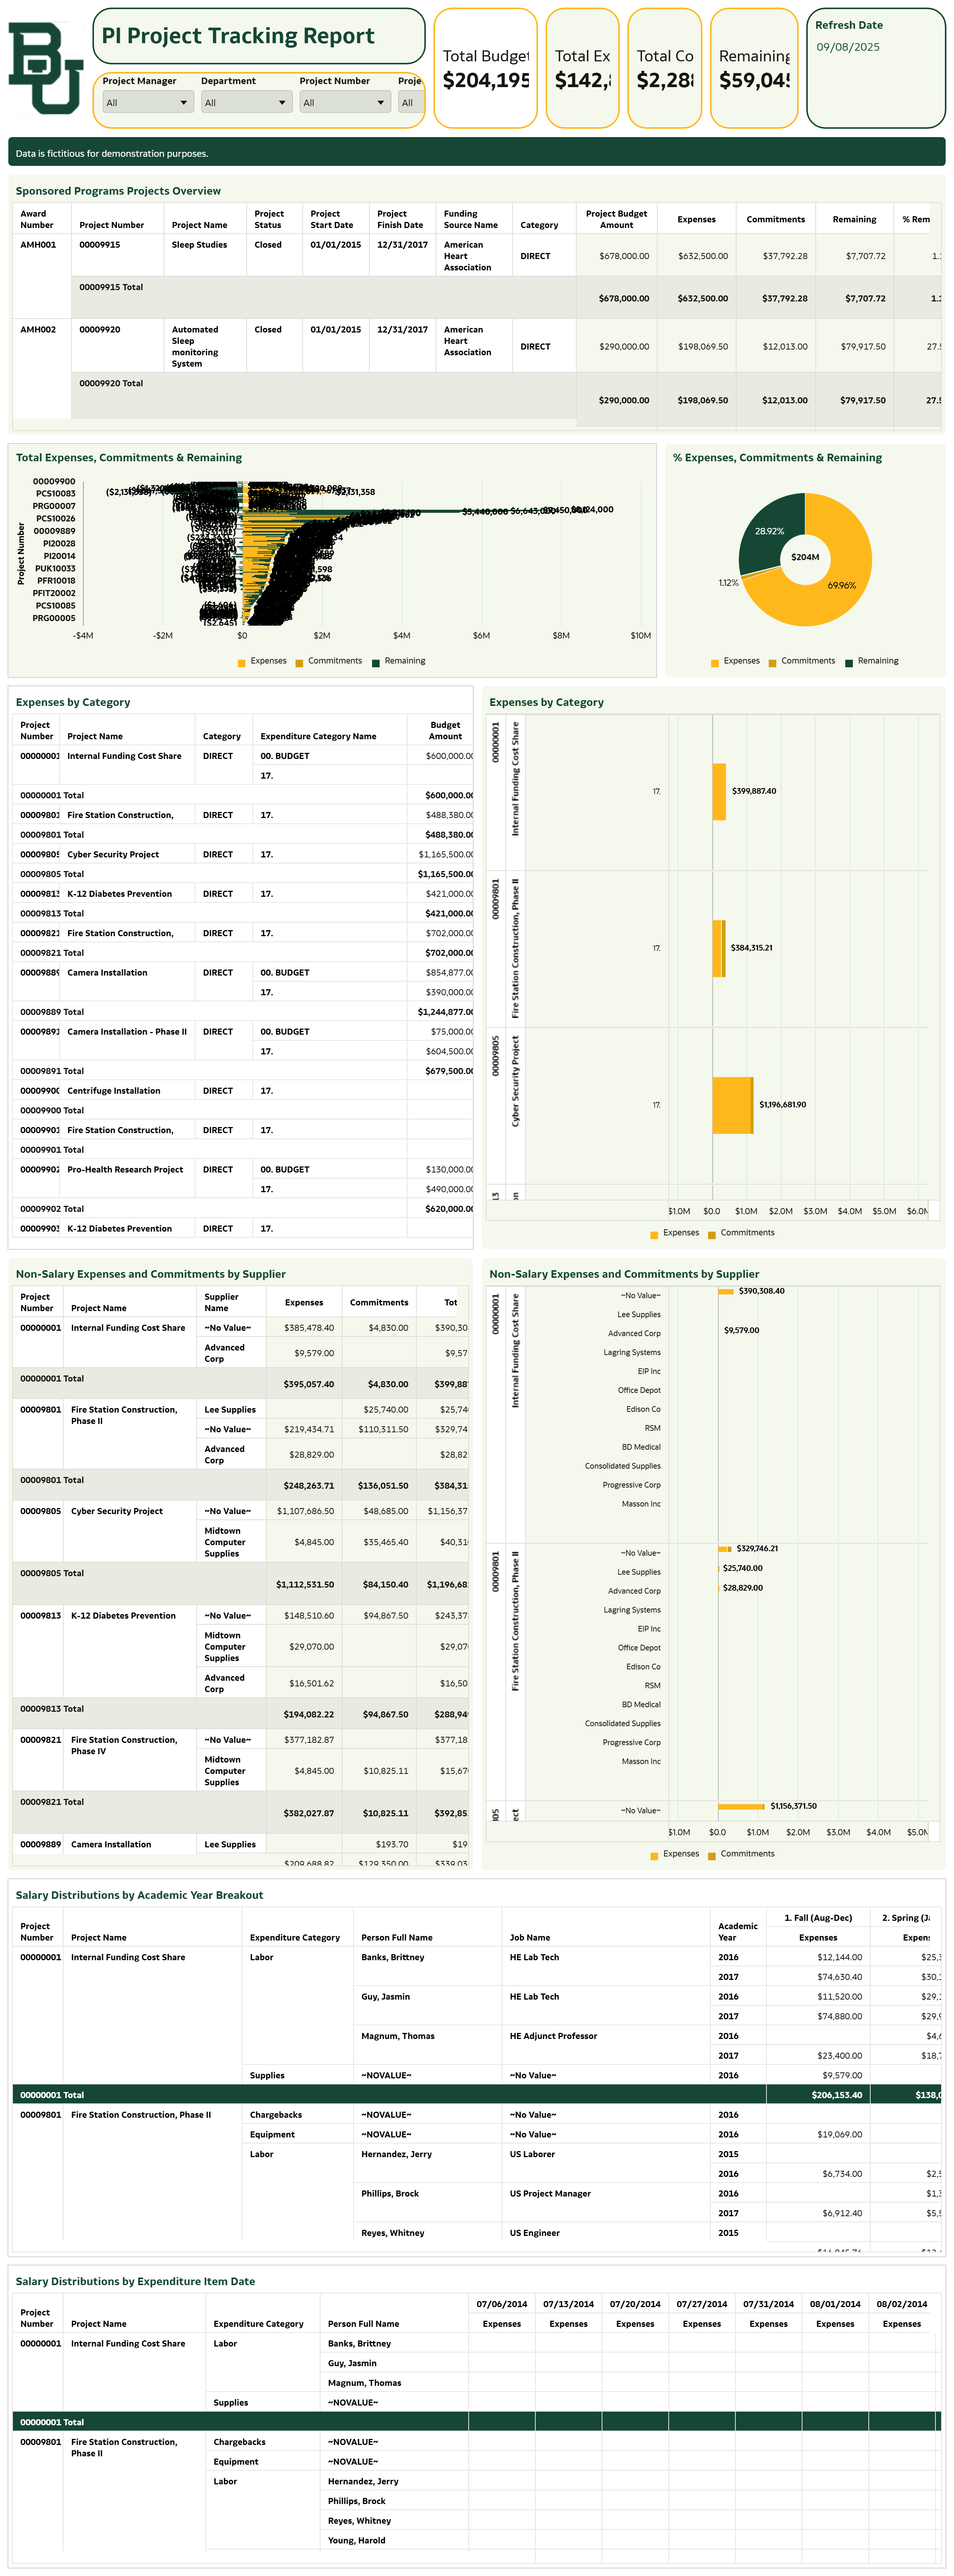
Note that data is fictional for demonstration purposes.


