The Road Condition Analysis dashboard was produced to show off how OAC could be used by companies in both the public and private sector, to modernise their analysis of the road network and better understand current conditions. The project utilised an AI vision model, running on an edge compute device, to collect data before storing it in the Autonomous Database and visualising the data in OAC.
OAC provides a perfect place to understand, interact and take action on the data presented, allowing users to be more efficient in repairing and maintaining roads.
In the initial image at the top of this post demonstrates the key capabilities of this dashboard, including:
- Where individual and clusters of potholes are
- Indicating what roads have already been checked and when
- The colour of the route determines when the road was last checked (Green: <3 months ago, Yellow: 3-6 months ago, Red: >6 months ago)
- What the potholes look like
This would allow repair teams to quickly assess areas with many potholes to be repaired, look at images to understand how serious the road damage is, and plan future scanning for unchecked roads.
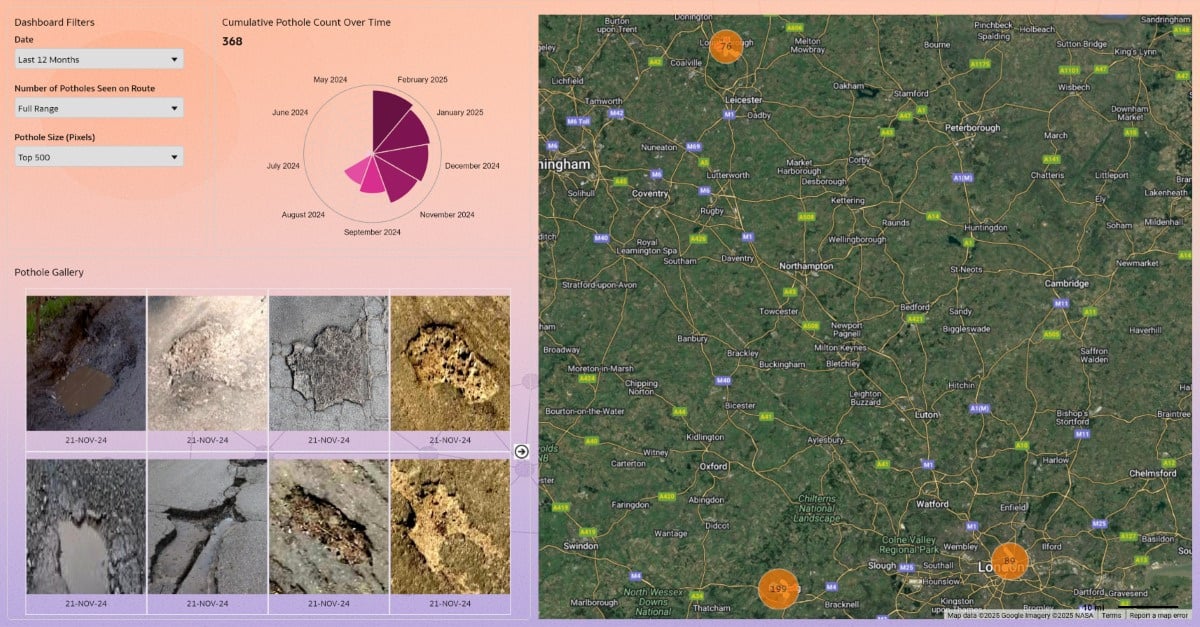
The following image demonstrates the key components of the dashboard, consisting of filters, change in potholes over time, pothole map, and image gallery. Each of these components can be interacted with to filter the data, providing an easy-to-use and informative dashboard to work with this geospatial data.
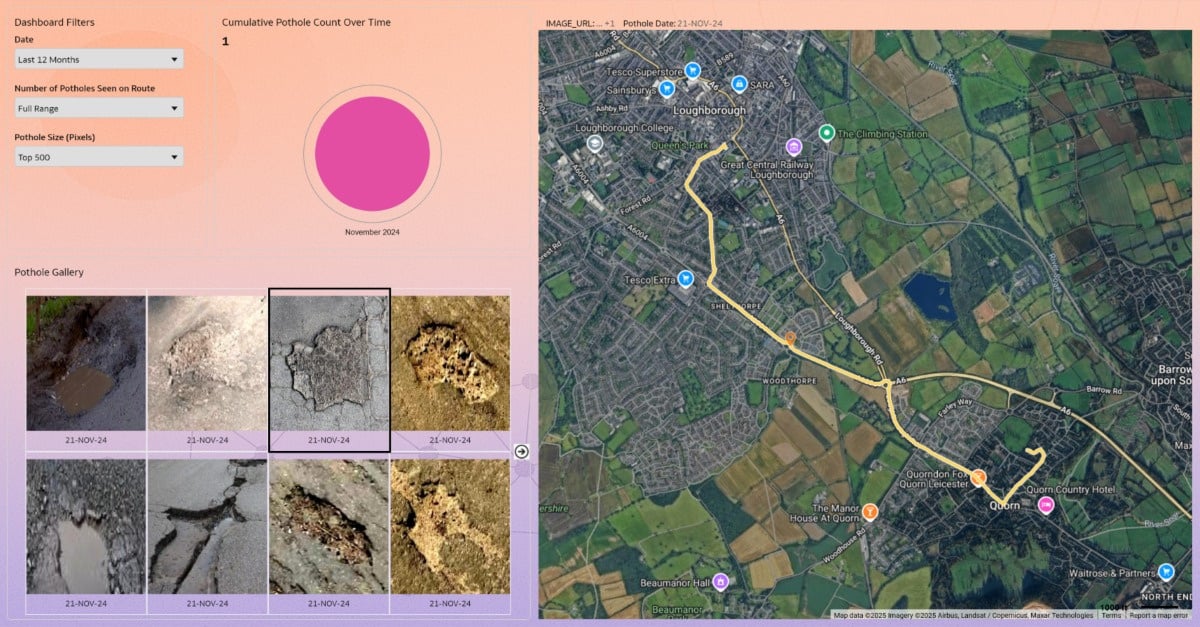
Further data interaction is also shown below where selection of a specific image will show the route taken by the vehicle when this pothole was spotted by the edge compute device's AI model a during the drive.
This OAC dashboard was created for my final year university dissertation.
Huge thanks to @Gautam Pisharam-Oracle for his knowledge, helping me to produce this!