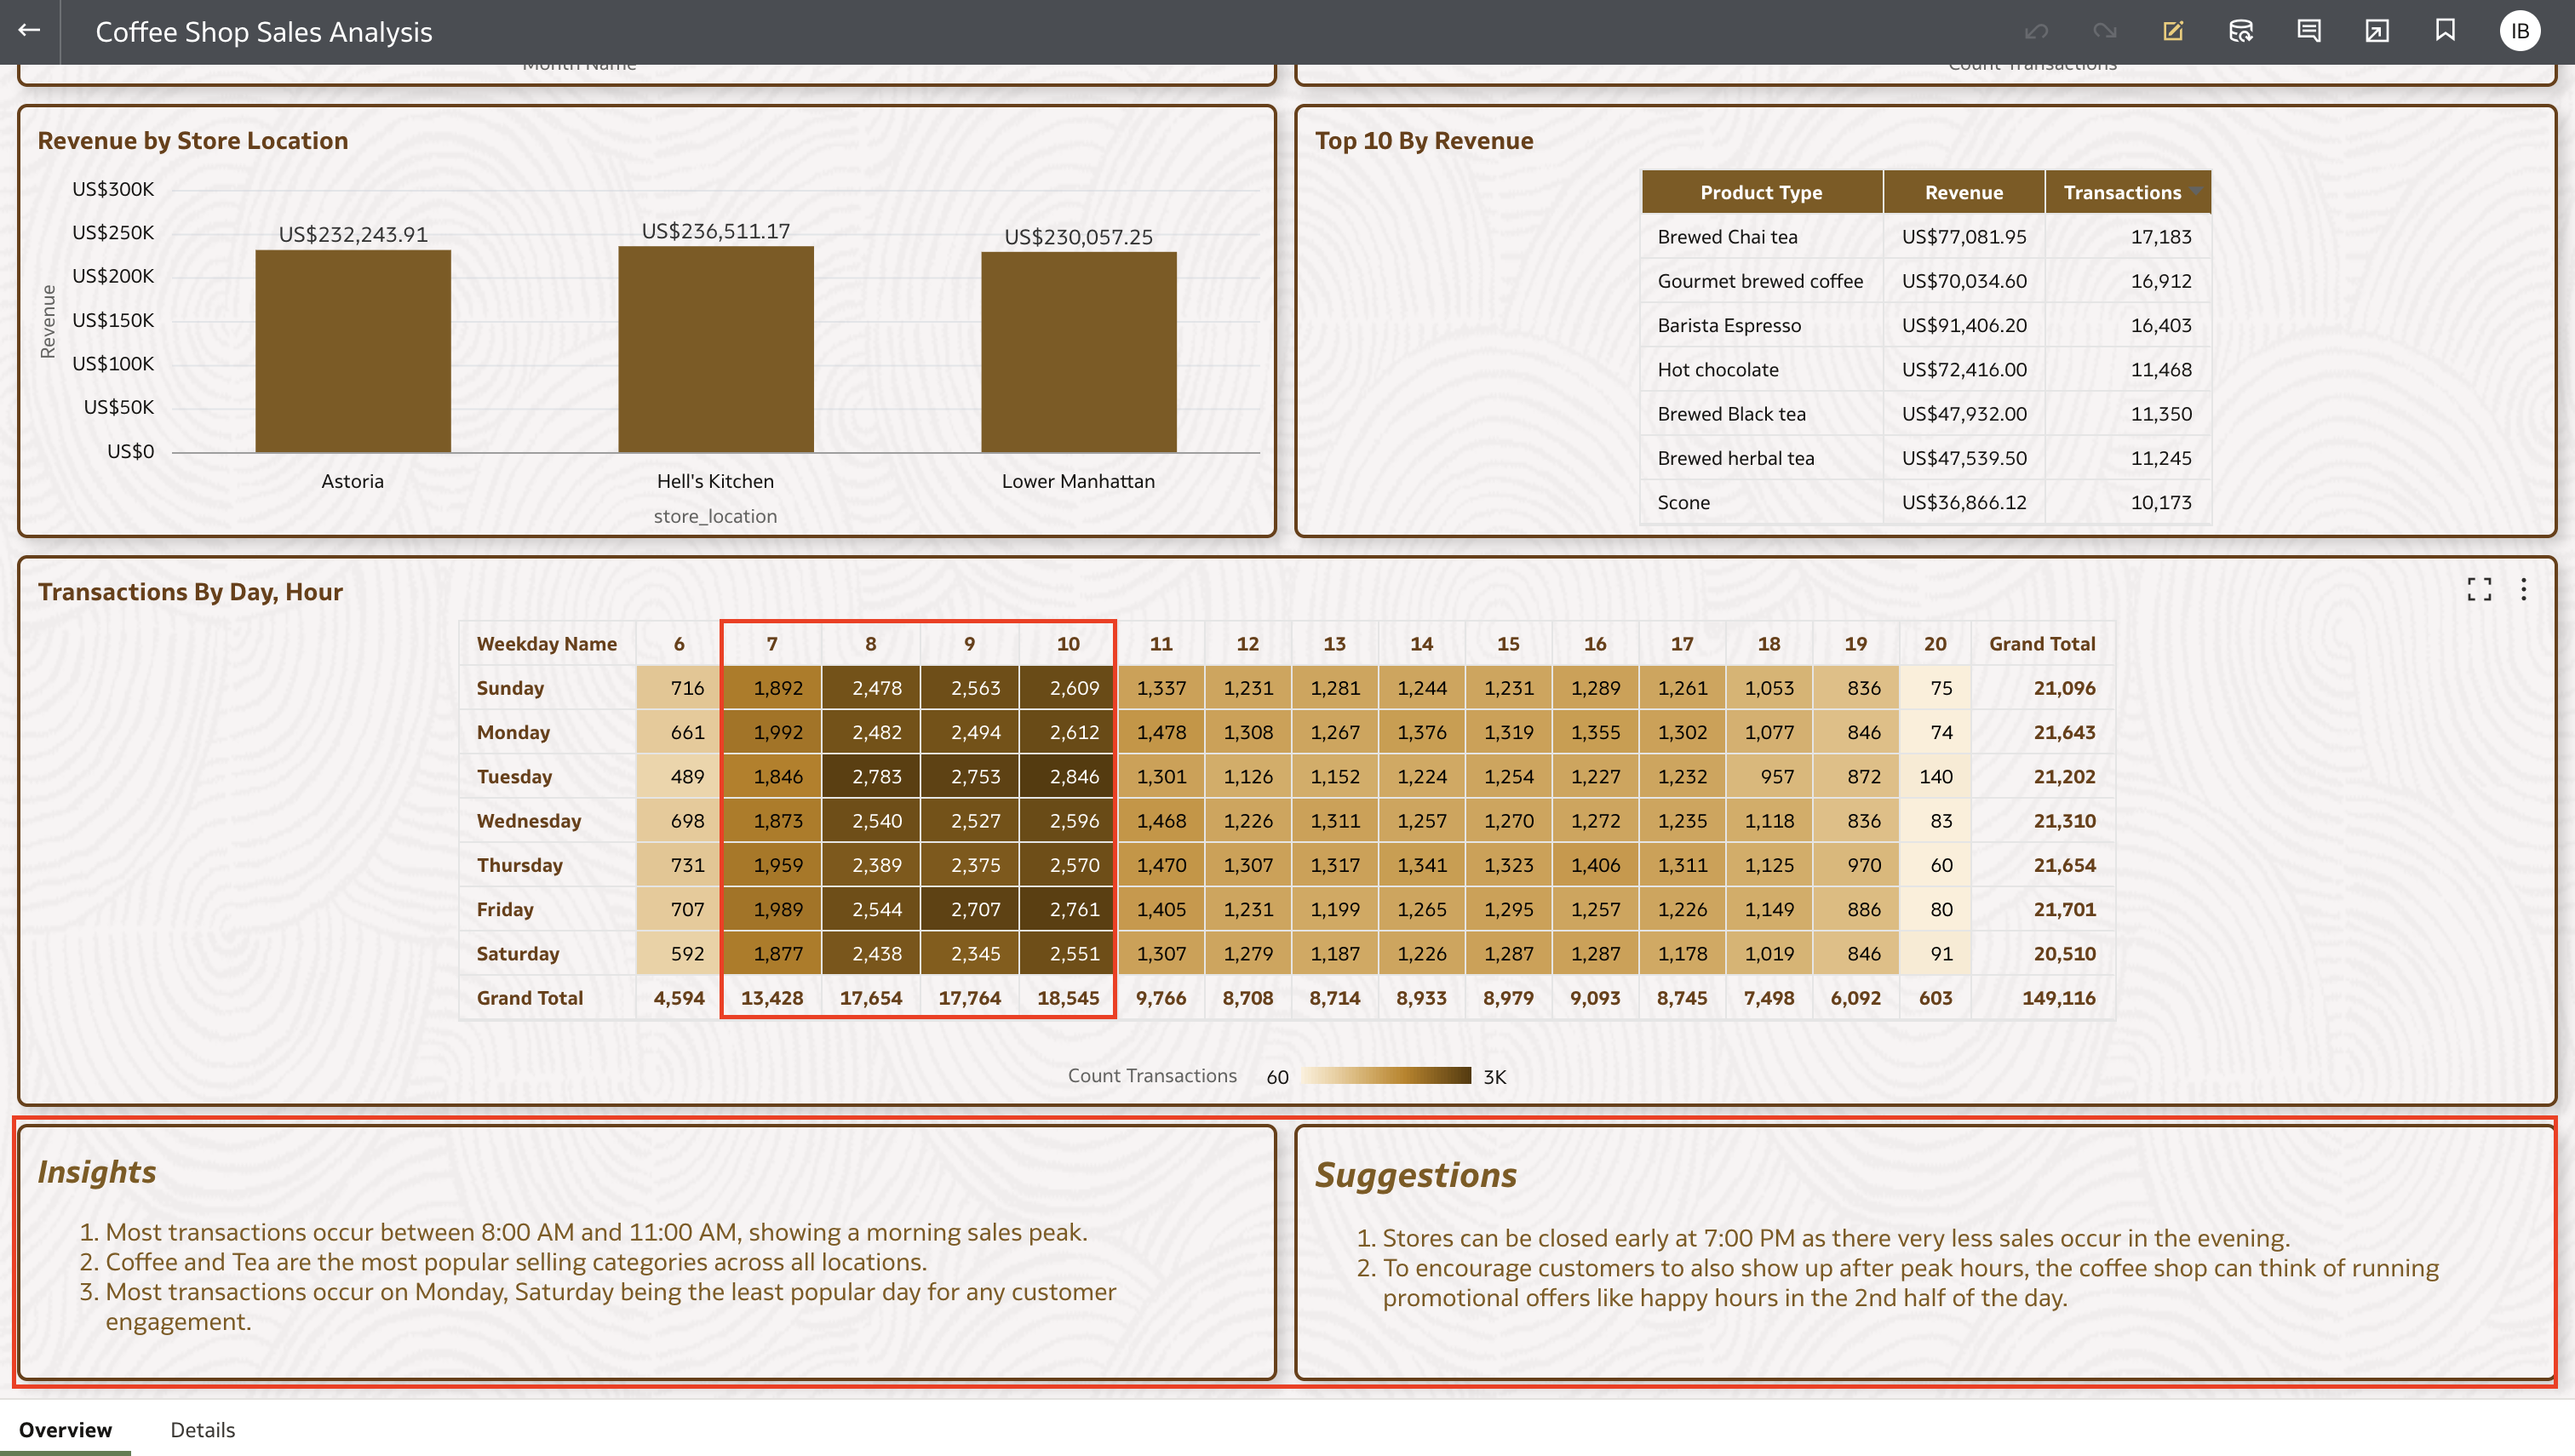
Here is the analysis showing the overview of the sales of coffee shop chain.
Very cool one with coffee theme and colors. Good work
Enjoying my morning cup of coffee while looking at this! Interesting topic and fantastic work @Ishan Bhutani-Oracle!
It would be great if the data available included information on when sales peaked during the day and by store location. I’d imagine Lower Manhattan would see more steady sales throughout the day compared to Astoria.
@Alexandria Toothman-Oracle Added a new visual to see the peak time of the sales and other observations/Suggestions at the bottom of the analysis.
I like the coffee theme for this :-)
Loved the Suggestions and Insights at the bottom. Amazing visualization and it makes me crave another cup of coffee. :)
Beautiful viz and very easy to understand.
Thanks for sharing @Ishan Bhutani-Oracle!
Well done. Surprising to me is that there is only a 5% difference in total transactions on Monday and Saturdays. Possibly showing that people enjoy coffee and tea every day of the week.
The September 2026 Oracle AI and Analytics Product Roadmap is here, bringing the latest product direction, innovation highlights, and upcoming capabilities into focus. This quarterly update gives you a fresh look at recently delivered innovations and what is ahead across Oracle AI Data Platform, OCI Enterprise AI, Fusion…
Description: Join our Product Management team to learn about new features that are part of 26.R3 Application release of Fusion Data Intelligence (SCM). The session will cover updates on Supply Chain Management and Procurement. Presented by: Anil Sebastian - Senior Director, SCM Product Management, Fusion Data Intelligence…
Agenda Presentation: What's New in FDI 26.R3 Open Q & A: Ask your questions of implementation and product specialists Replays of past FDI CEAL Guidance Office Hours are available on Oracle VideoHub here. Fusion Data Intelligence - CEAL Guidance Office Hours The FDI Office Hours are hosted by CEAL solution architects who…
Description: Join our Product Management team to learn about new features that are part of 26.R3 Application release of Fusion Data Intelligence (CX). The session will cover updates on Service, Sales, Marketing & other relevant areas. Presented by: Kausik Misra - Director, CX Product Management, Fusion Data Intelligence…