Categories
- All Categories
- Oracle Analytics Learning Hub
- 30 Oracle Analytics Sharing Center
- 19 Oracle Analytics Lounge
- 239 Oracle Analytics News
- 45 Oracle Analytics Videos
- 16K Oracle Analytics Forums
- 6.3K Oracle Analytics Idea Labs
- Oracle Analytics User Groups
- 88 Oracle Analytics Trainings
- 16 Oracle Analytics and AI Challenge
- Find Partners
- For Partners
How can I get default results in a graph under a manager when the manager is the logged-in user?
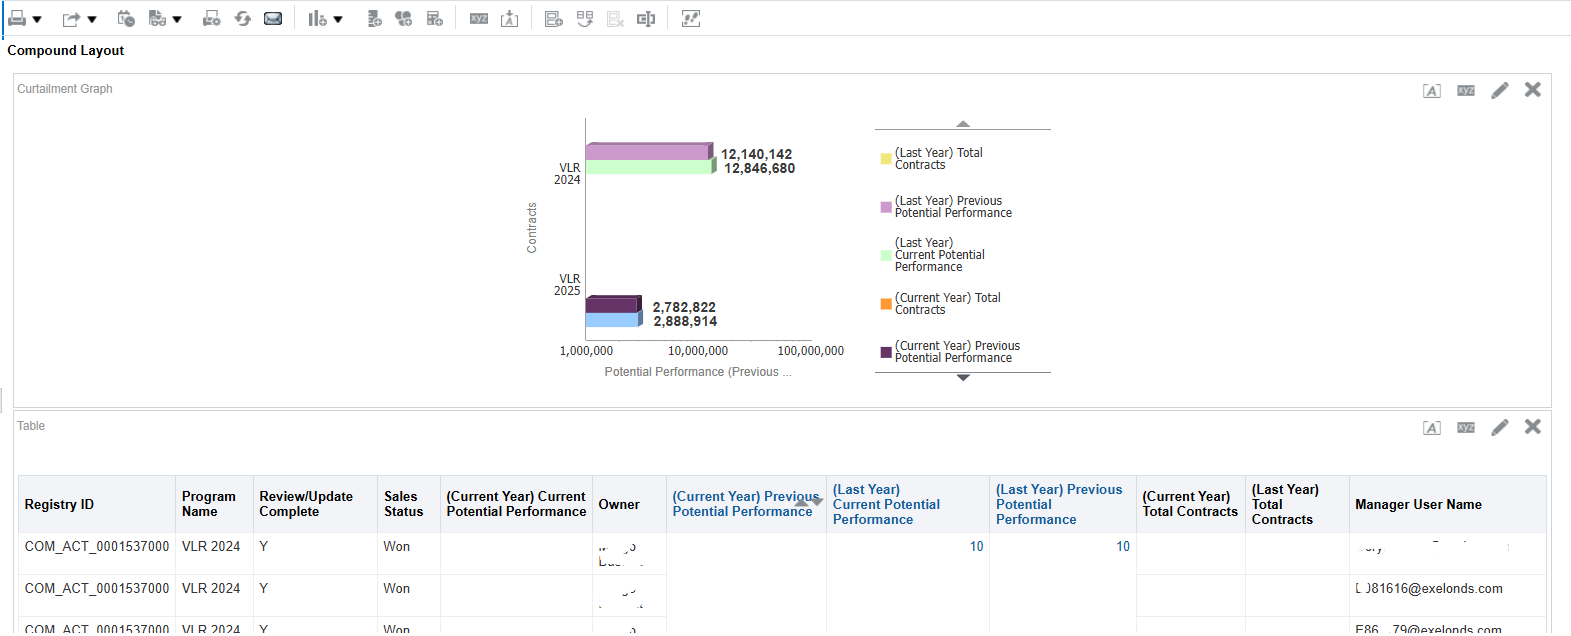
I am using OTBI-analysis in creating curtailment report. It will be shown as infolet in Oracle Sales Cloud. I need 2 subject area because I need the default result of the graph to be the counts of curtailment under the manager.
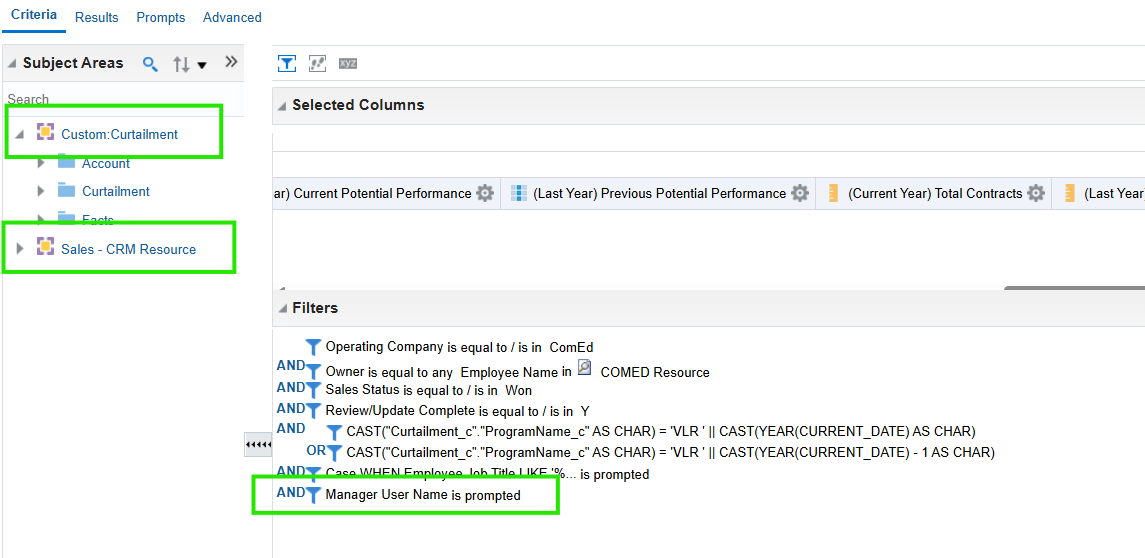
The result is incorrect because the managers username is not correct per account.
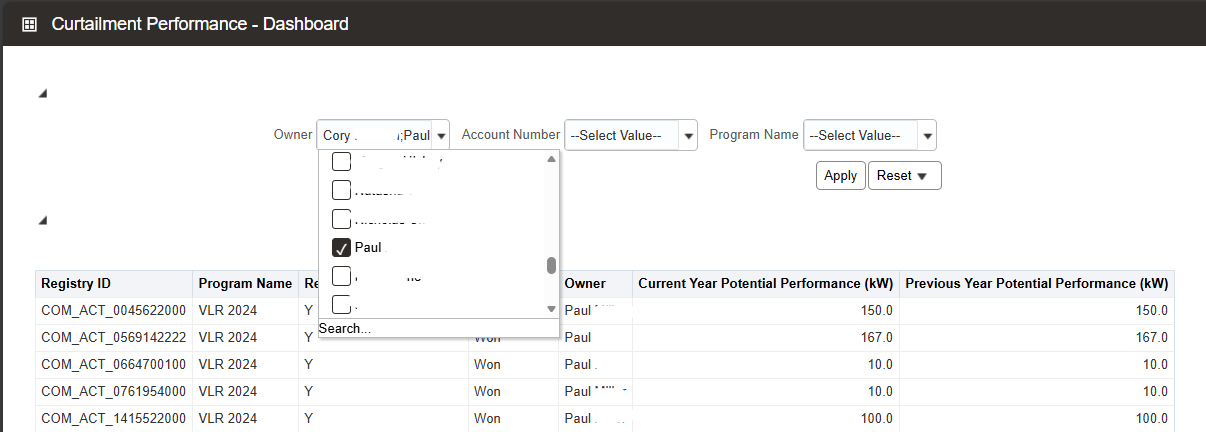
This should be the correct output. Paul is under Cory. But I can't make the same output in the graph because the filter only works in the prompt.
Answers
-
Can you try with the subject area that provides the correct manager hierarchy, and then use Add Related Subject Area to merge all other needed subject areas into one?
0 -
Hello @RVohra ,
The Sales-CRM Resource is the correct subject area, maybe there are other ways aside from using 2 subject areas ?
0 -
Hopefully, someone from Oracle can pitch in and provide some insight.
1


