This dashboard will be featured in the Data Visualization Optimization webinar on Wednesday, December 10th, 2025.
Register for the webinar and the recurring series here.
If you have questions about the features in this dashboard, please post them below!
Special thanks goes to Jamie Selander (@User_ID85L) and The University of Texas System team for allowing us to feature their initial workbook as inspiration for this optimized dashboard, and members of the Oracle Design team: Sarahi Tenorio (@Sarahi Romero-Oracle) and Cara Kleid.
Notable features of this workbook:
Present mode
- Header customization
- Enabling Assistant/Agent
- Responsive set up
Visualize
- Freeform Layout
- Backgrounds
- Parameters (Dynamic text box)
- Buttons
- Filter design customization
- Data Actions
- Tooltip
- Gantt chart New Feature
- Column Swap New Feature
- Date Based Conditional Formatting New Feature
- Plugins (Vision Plugin)
AI
- AI Agent New Feature
- Home Page AI Assistant New Feature
- AI Assistant on Mobile New Feature
DVA (Compatible with OAC Instances from November release):
This workbook is also accessible to be viewed in consumer mode on OAC Public.
Webinar Replay:
Watch here if the embedded video does not load properly for you.
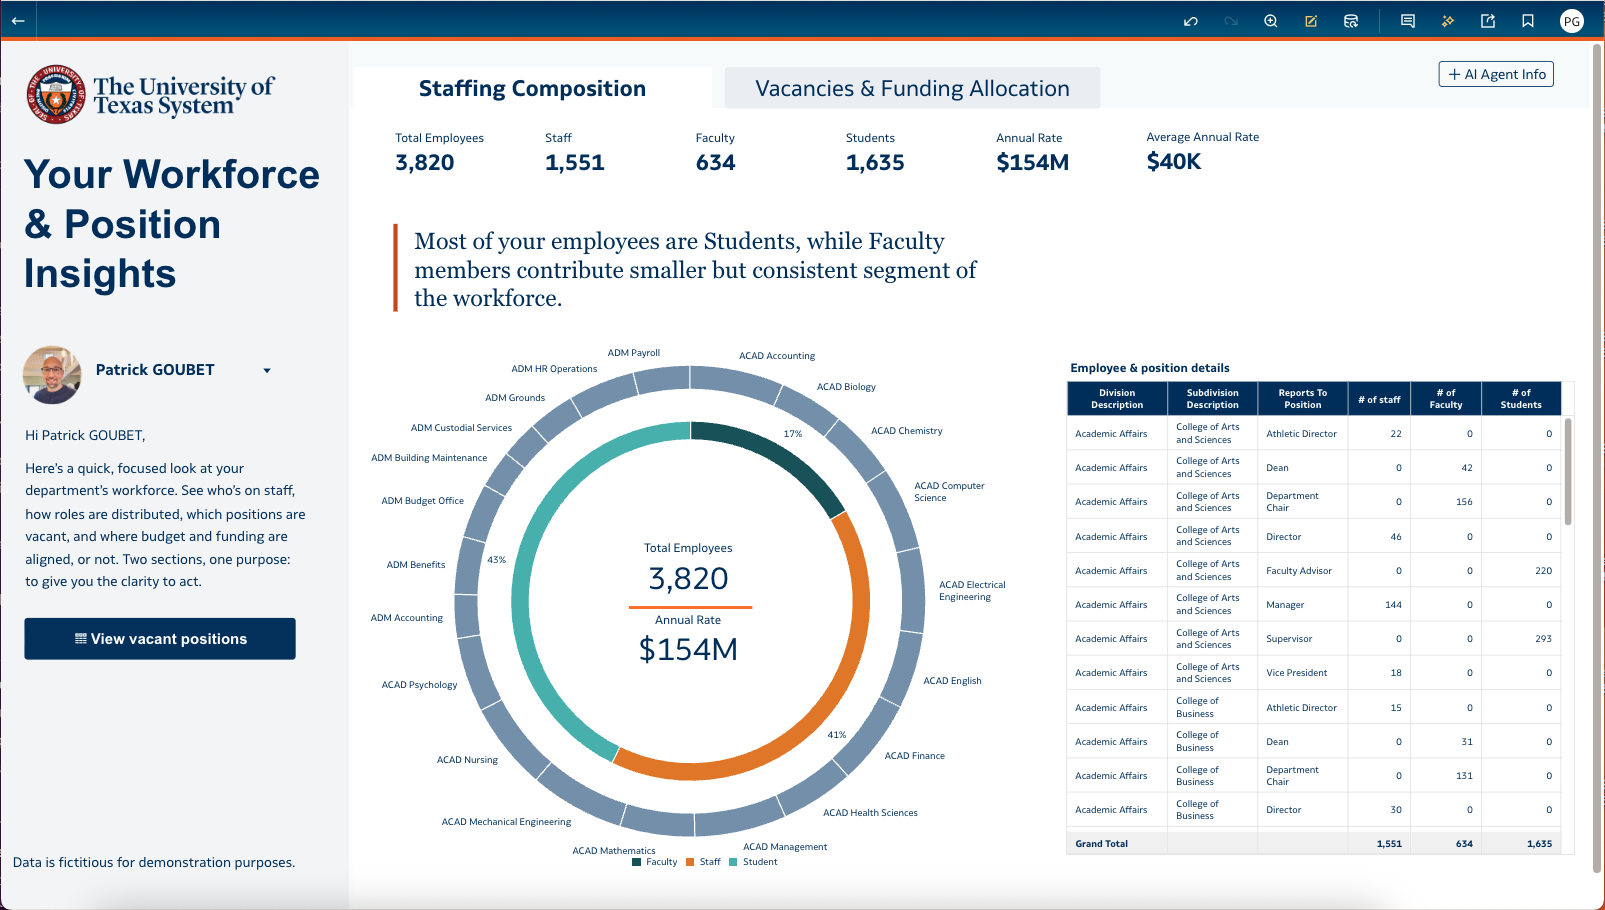
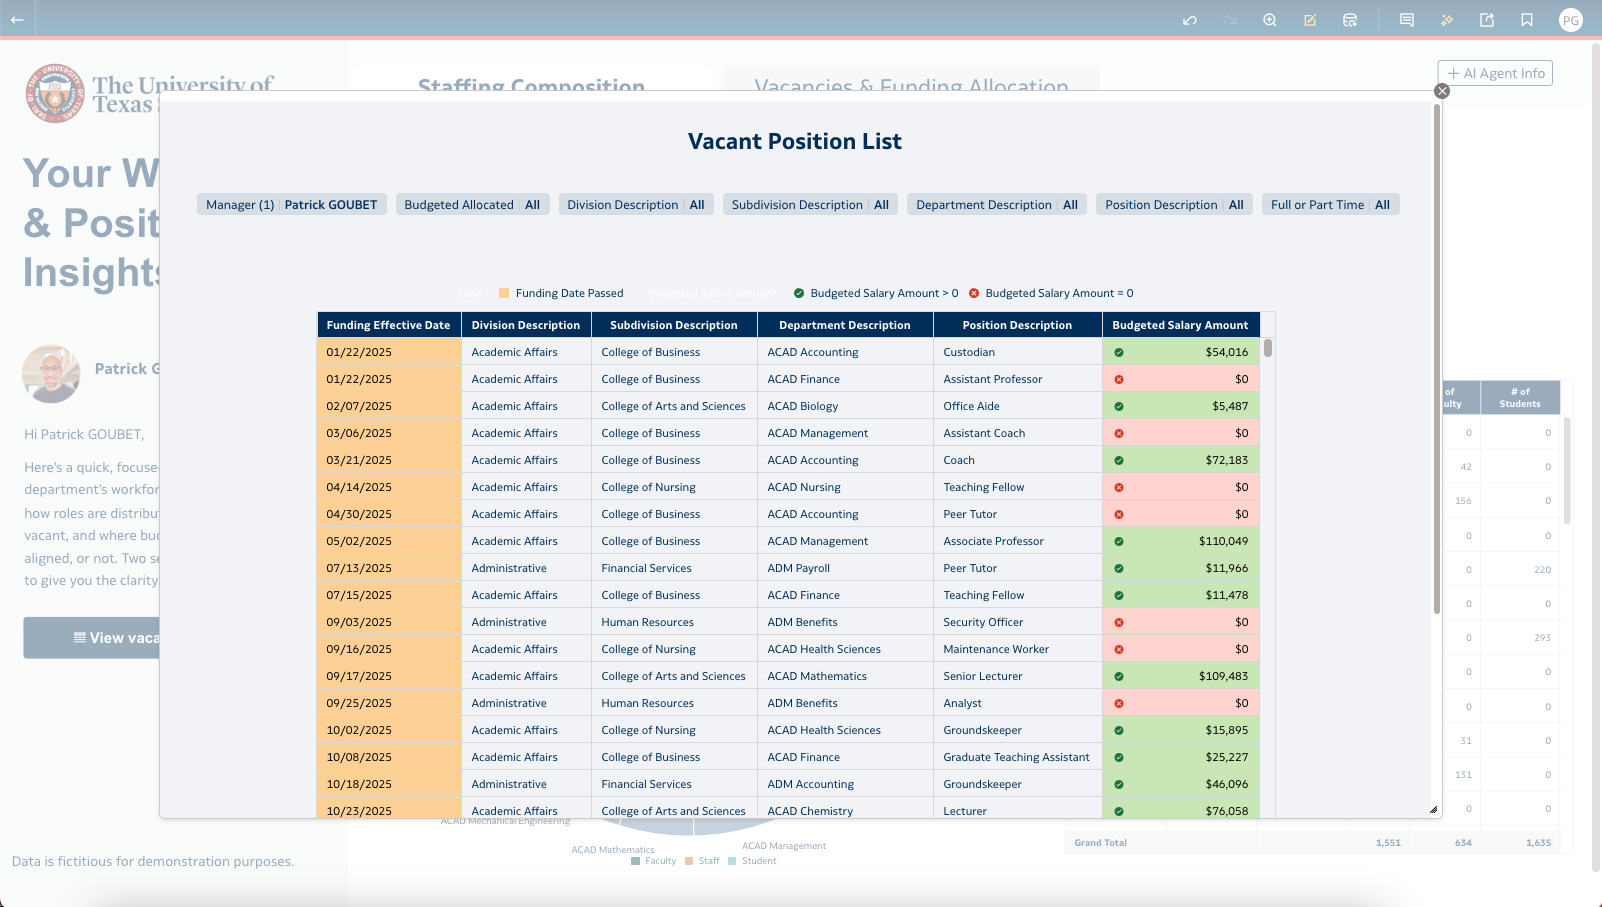
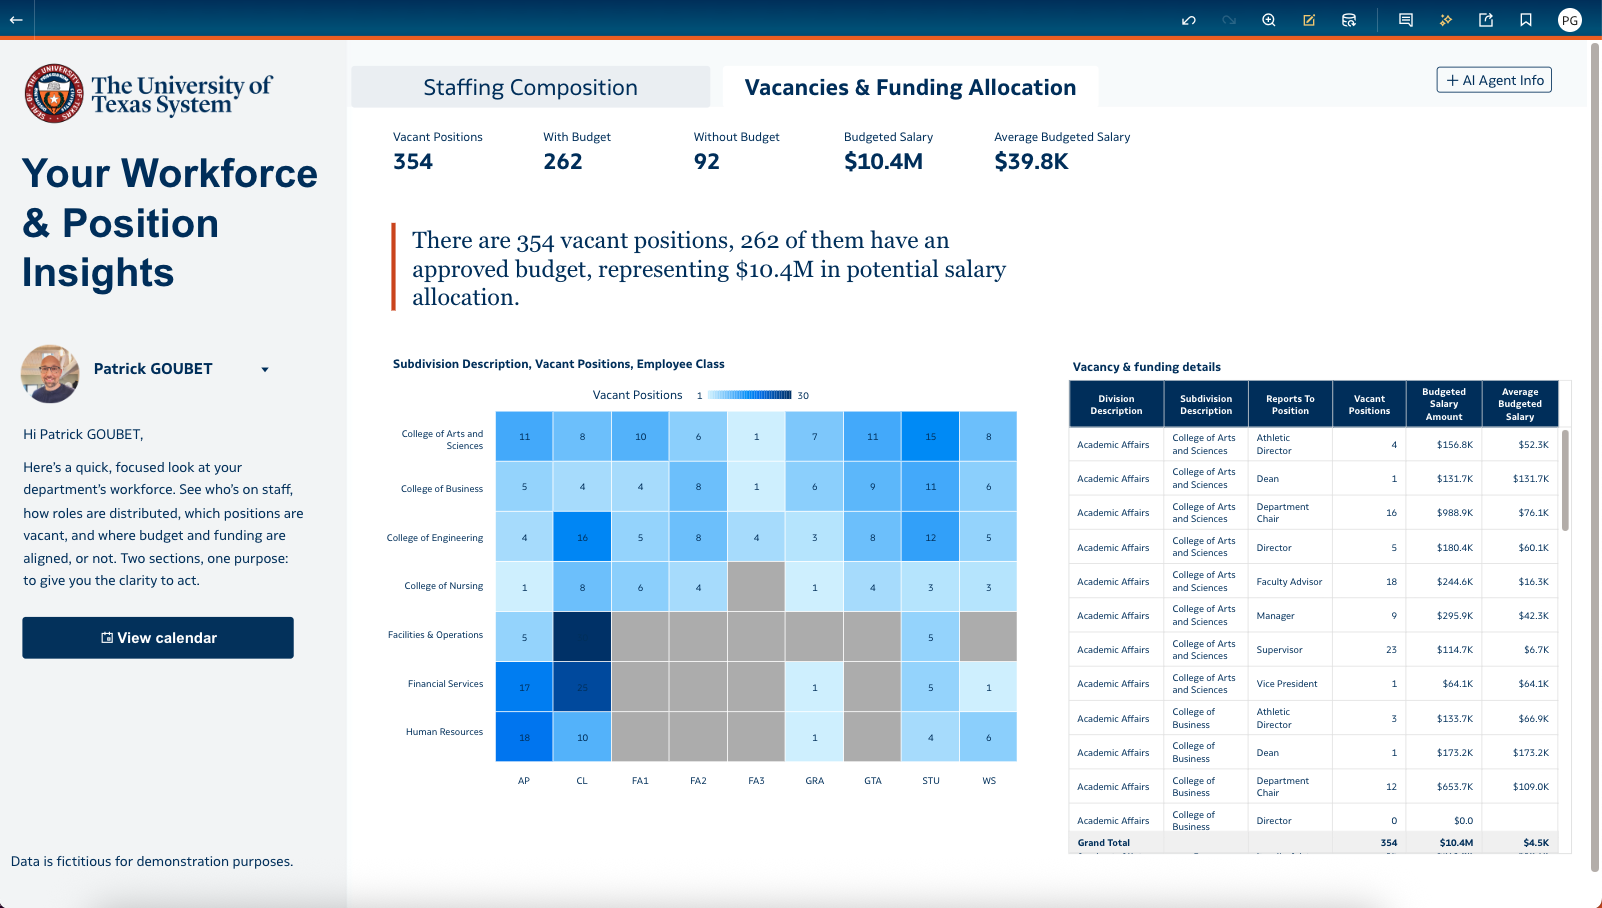
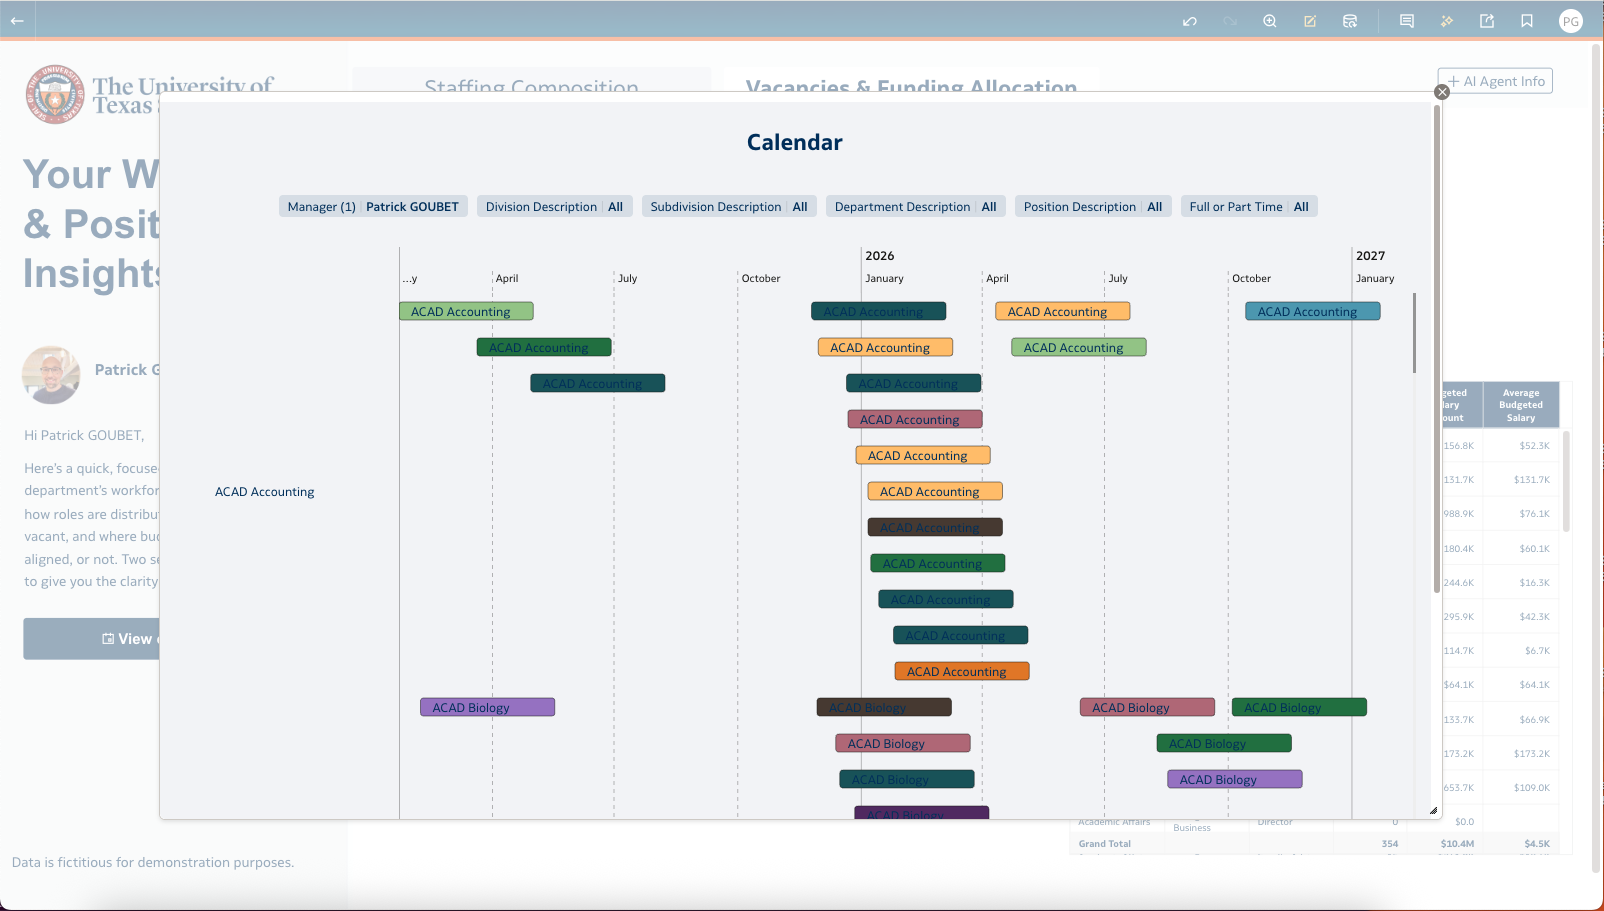
Optimized Dashboard:
Note that data is fictional for demonstration purposes. Click the image for a larger version.
Note that data is fictional for demonstration purposes.
Register for the upcoming webinar today!