Ready to transform your data into engaging, easy-to-understand visuals? Review the recording—Create Impactful Infographics with Oracle Analytics—and discover the techniques and best practices for designing infographics that tell a compelling story, clarify complex data, and inspire action. Attendees will learn how to leverage Oracle Analytics to craft professional infographics that make an impact.The session will guide you through the fundamentals of effective infographic design, from setting goals and gathering inspiration, to mastering key elements like typography, color, charts, and layout. You’ll walk away with practical tips, a step-by-step workflow, and examples you can apply directly to your projects—regardless of your experience level.
Why Join?
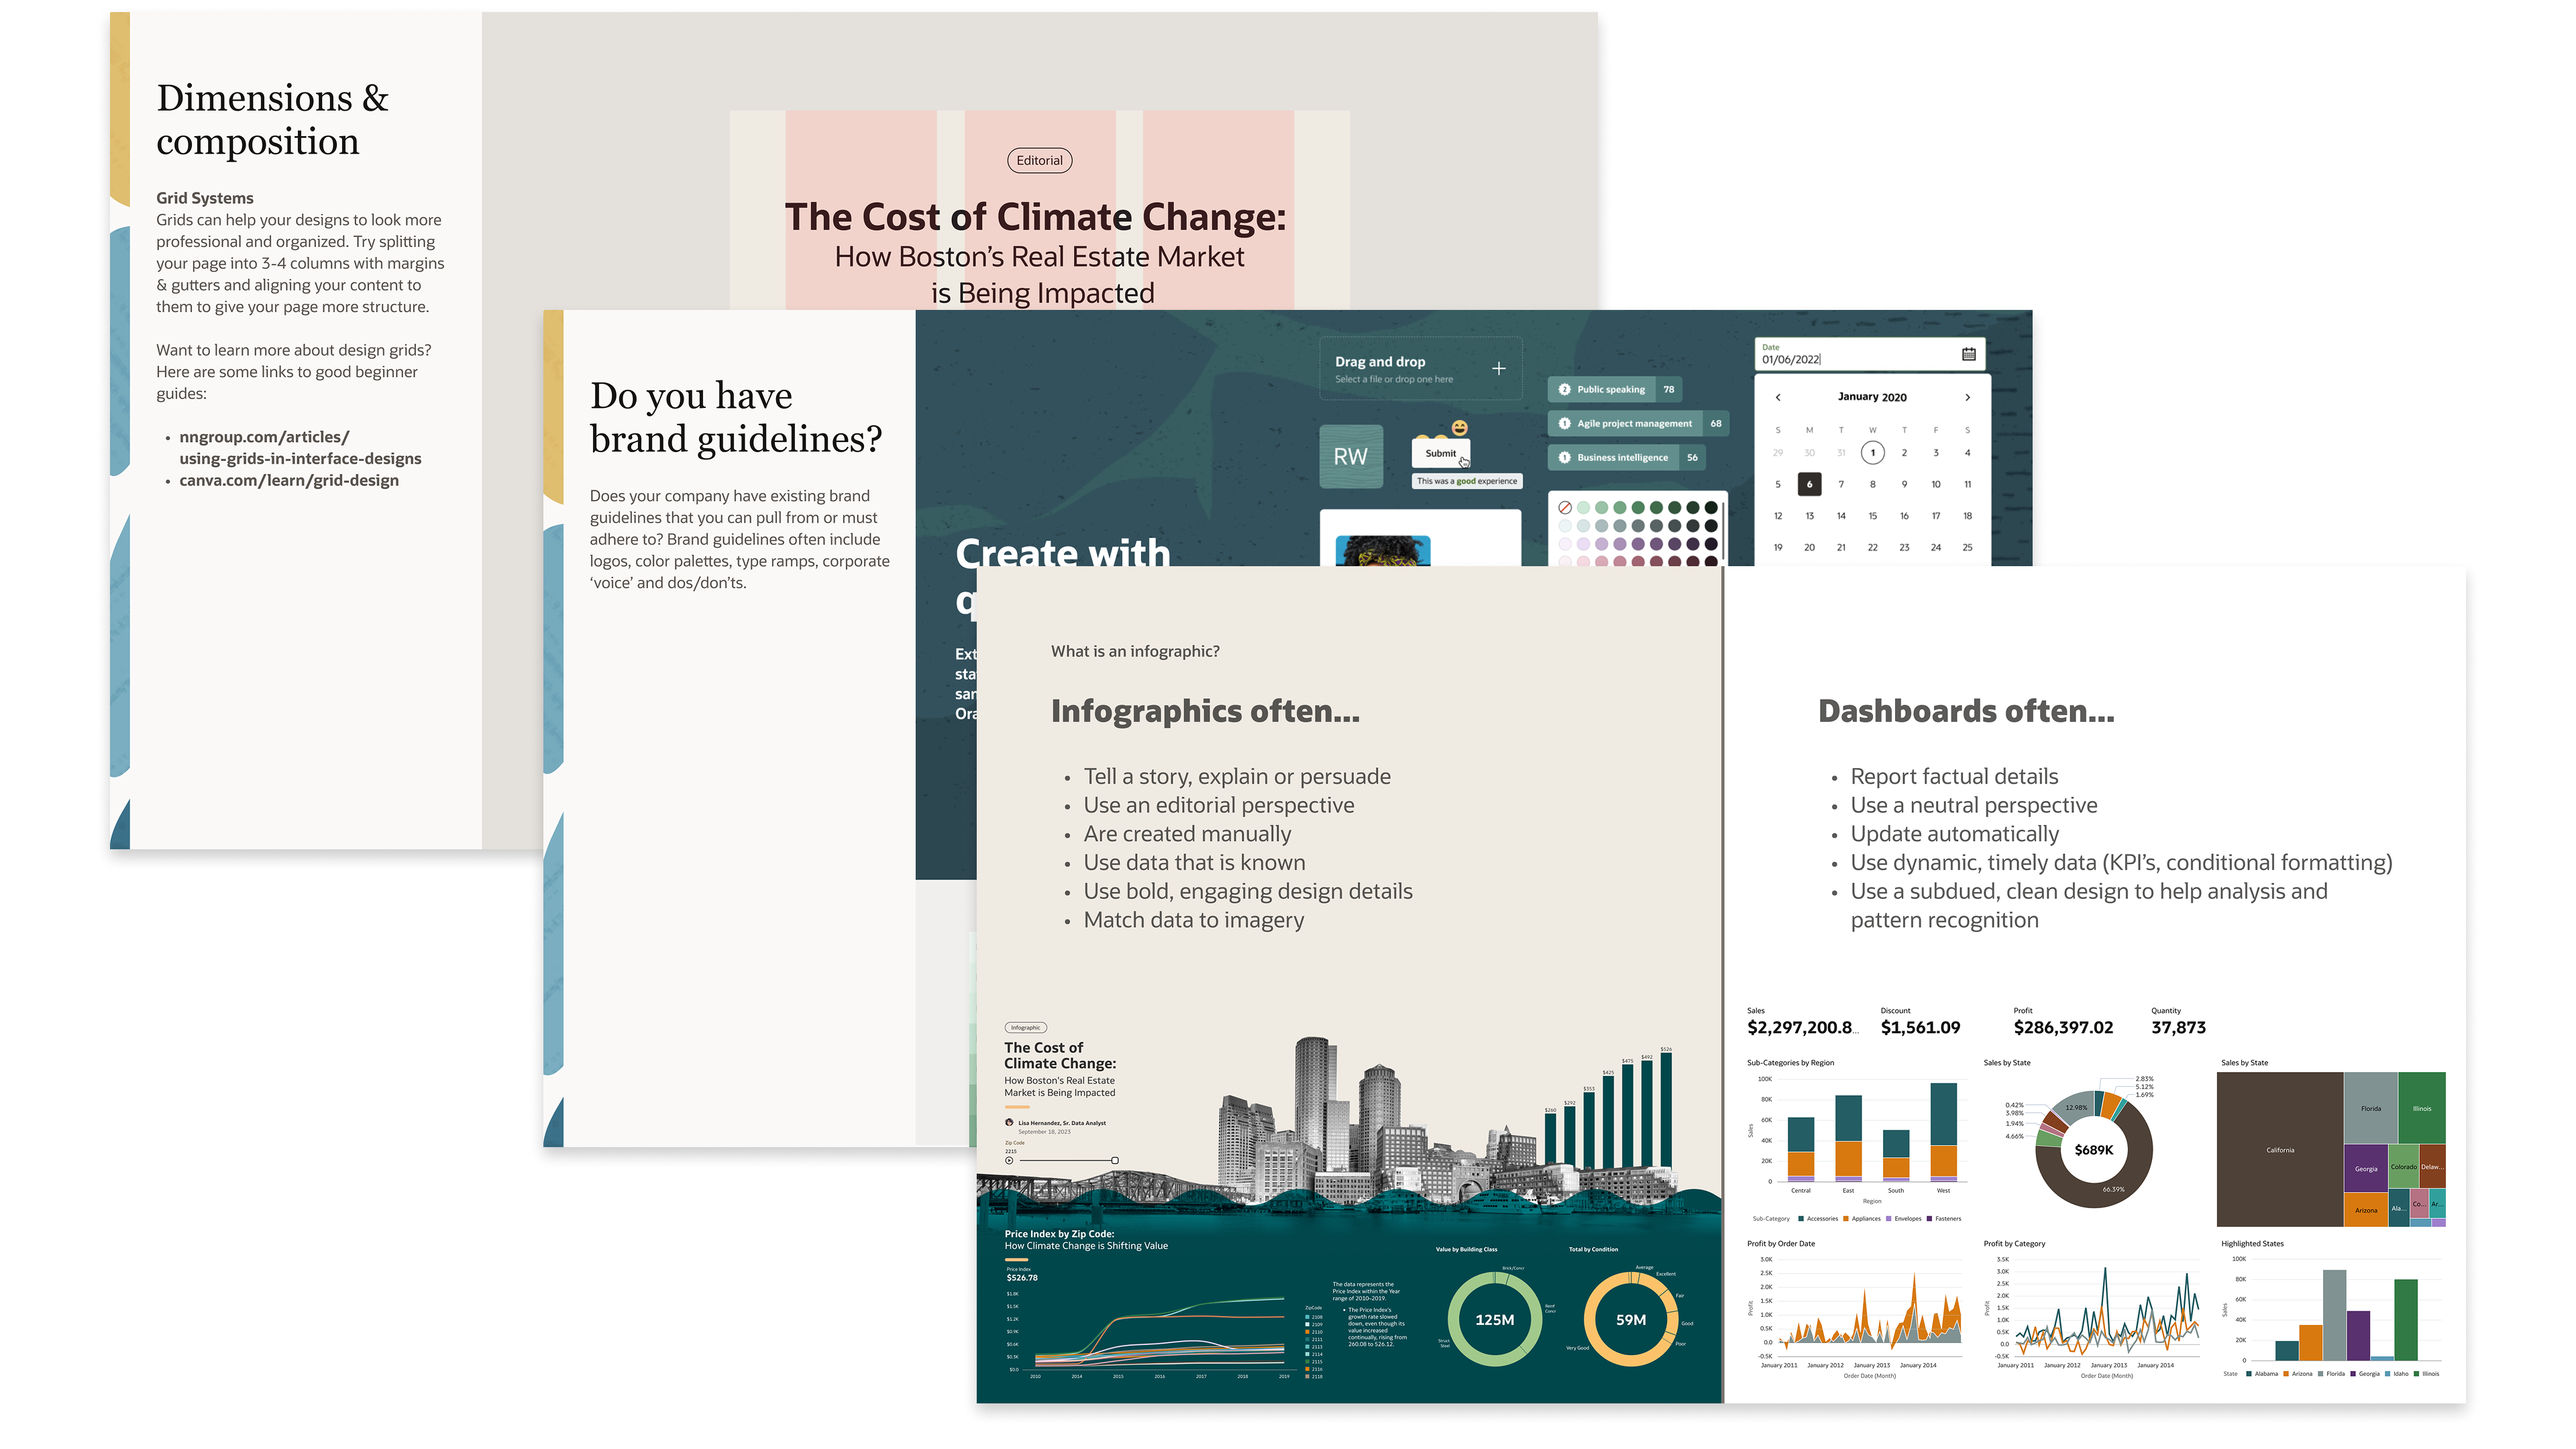
- Learn the critical differences between infographics and dashboards
- Follow a clear, step-by-step process for creating standout infographics
- Gain actionable insights on typography and color to enhance visual appeal
- Discover creative techniques for combining charts and imagery
- Master layout basics for cohesive, professional designs
- Optimize images for better performance in Oracle Analytics
- Access post-event resources and join the Oracle Trainings Forum for ongoing support
Create Impactful Infographics
Watch the Replay Here
January 29, 2026
11:00 AM – 12:00 AM CT
Presenter: Dustin Bauder