1. Which dataset did you use?
Netflix Users Database available at Kaggle. https://www.kaggle.com/datasets/smayanj/netflix-users-database
2. How did you analyze or prepare the data?
Based on my experience in Analytics field and a little help from Insights feature in OAC.
3. Who is the intended audience for your visualization?
User Engagement Team.
4. What is your visualization about, and what question or problem does it address?
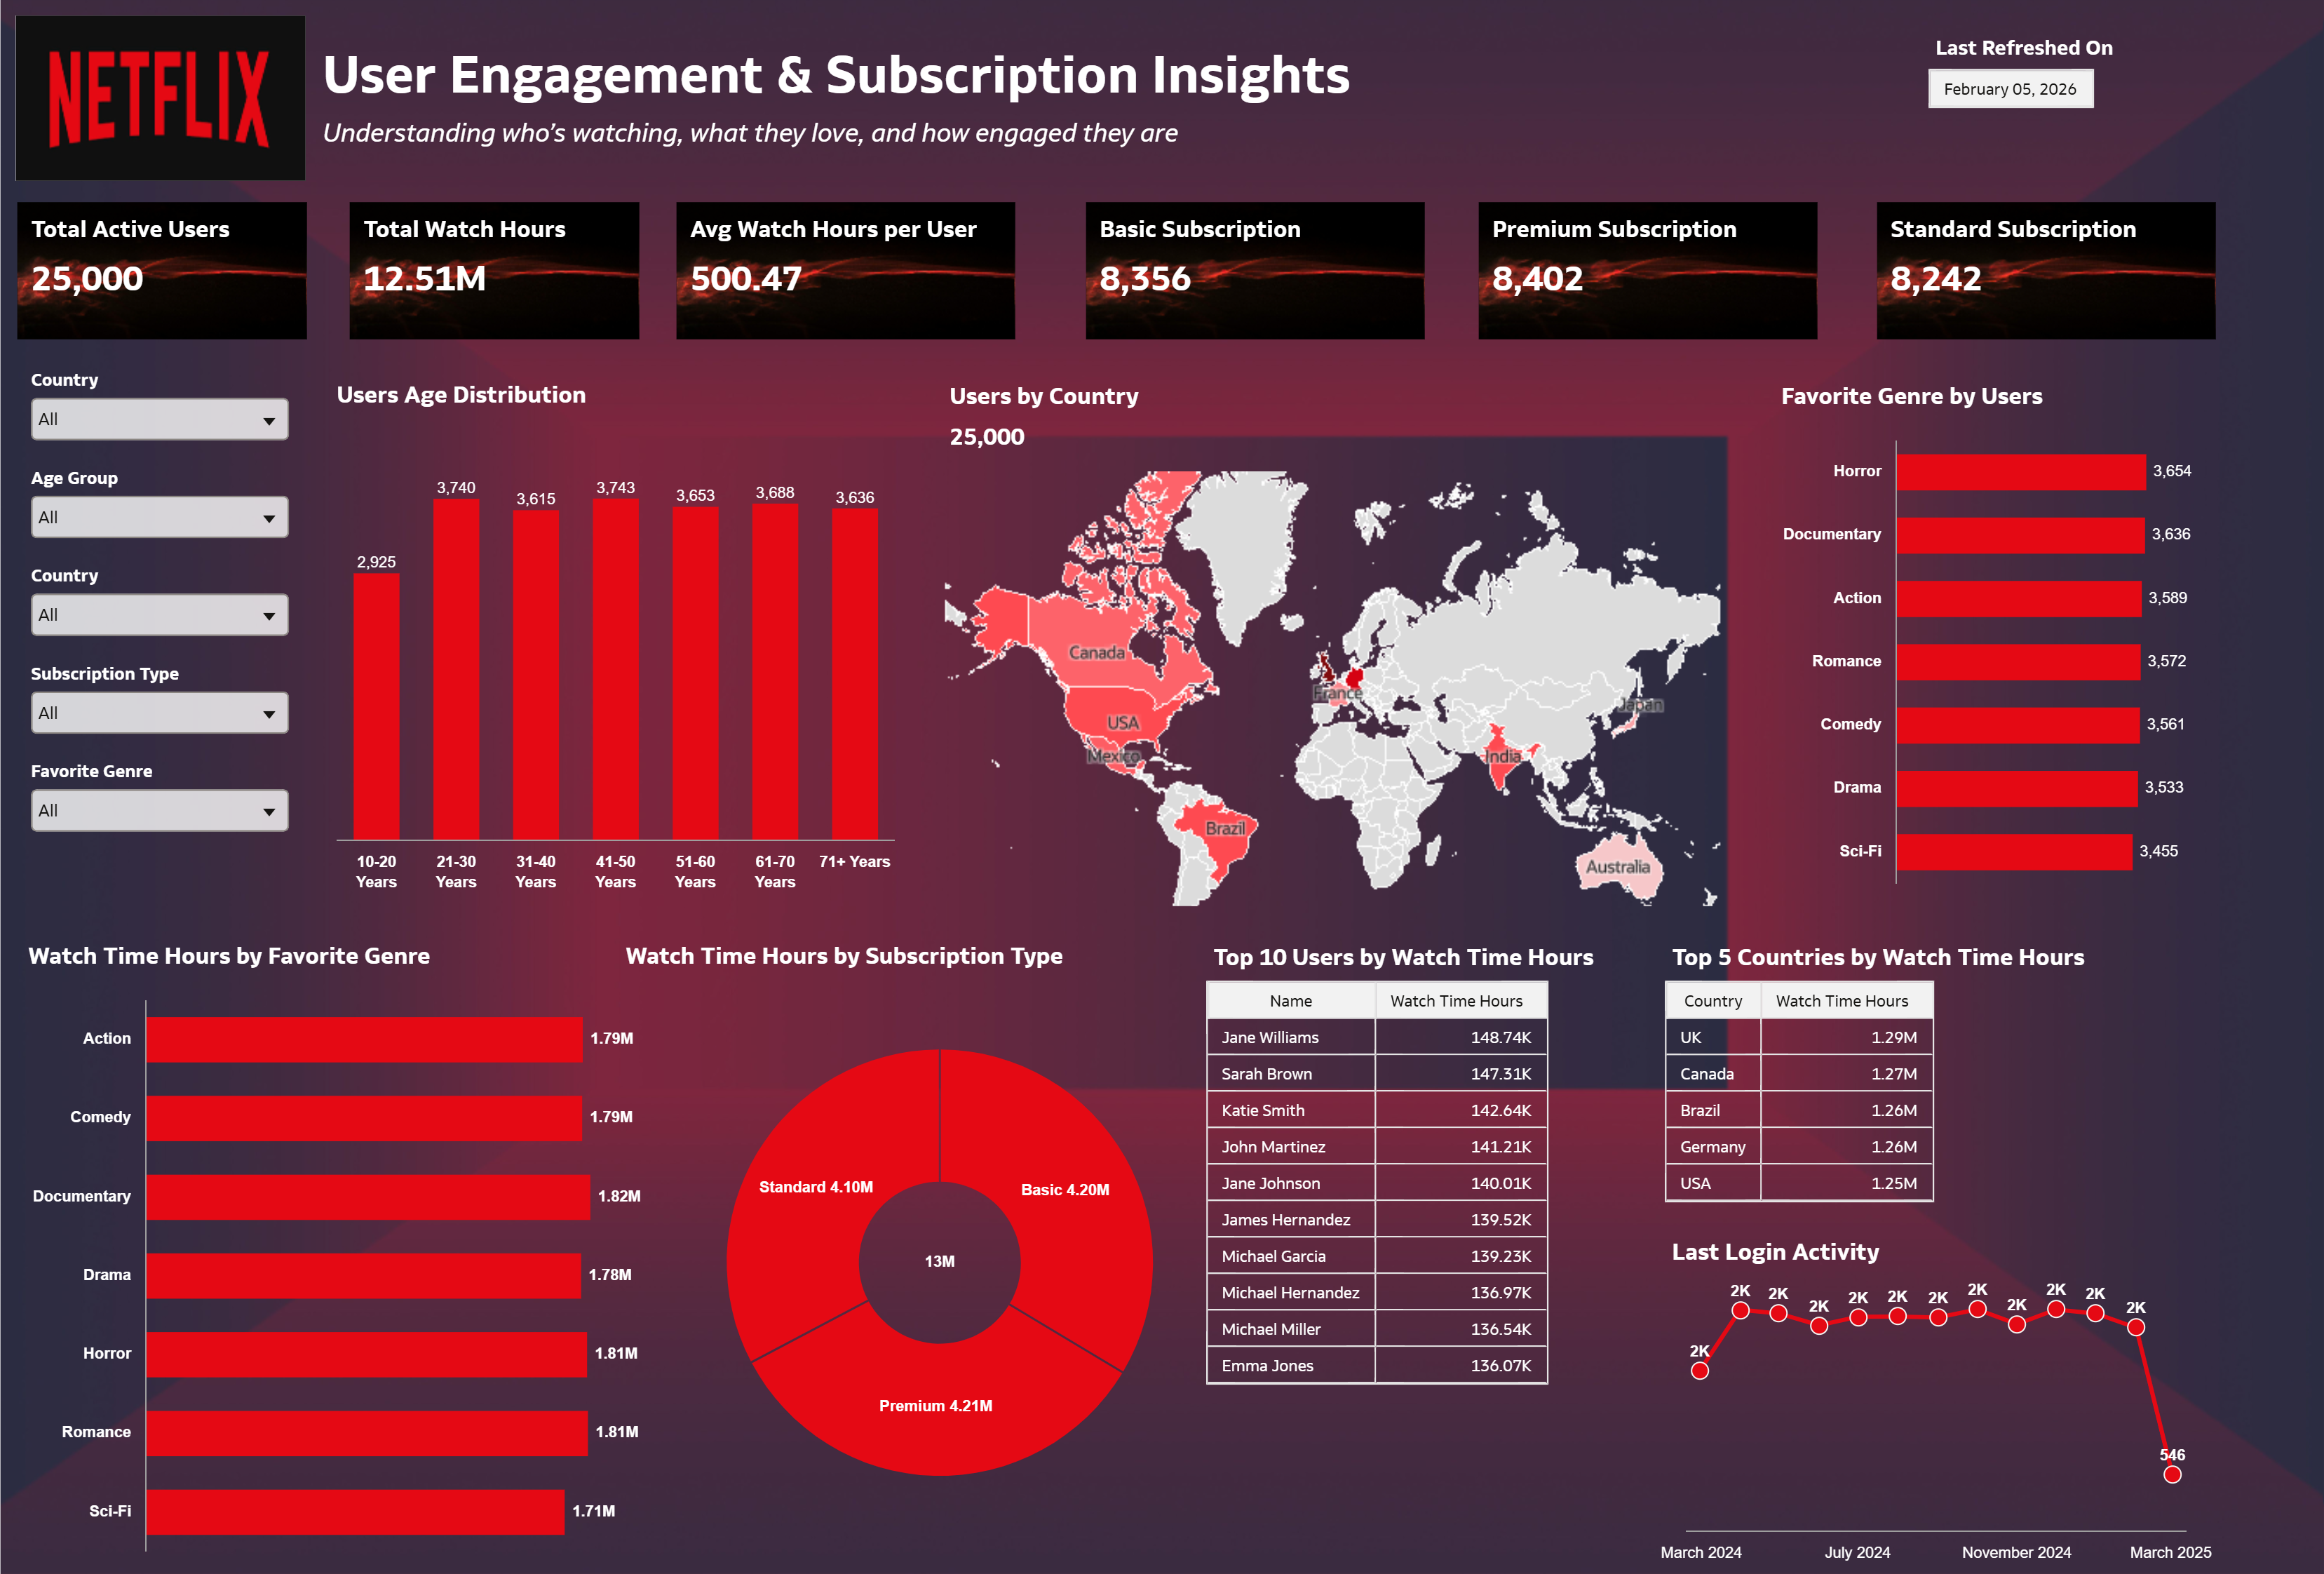
This dashboard provides a comprehensive view of Netflix user behaviour, engagement levels, and subscription trends. It highlights who the users are, how they interact with the platform, what content they prefer, and how actively they stream. By combining demographic insights, watch-time analysis, genre preferences, and subscription distribution, the dashboard helps identify high-value audiences, engagement patterns, and potential churn risks. These insights support data-driven decisions to improve content strategy, user retention, and subscription growth.
5. Did you use any Oracle Analytics AI features when building your visualization (ex. AI Assistant)? If so, please describe how they were used
No. it was not required this time to build the Visualization.
6. Did you upload your visualization image and dva file?
Completed.
(Entry #2 - Oracle Analytics and AI Challenge 2026)