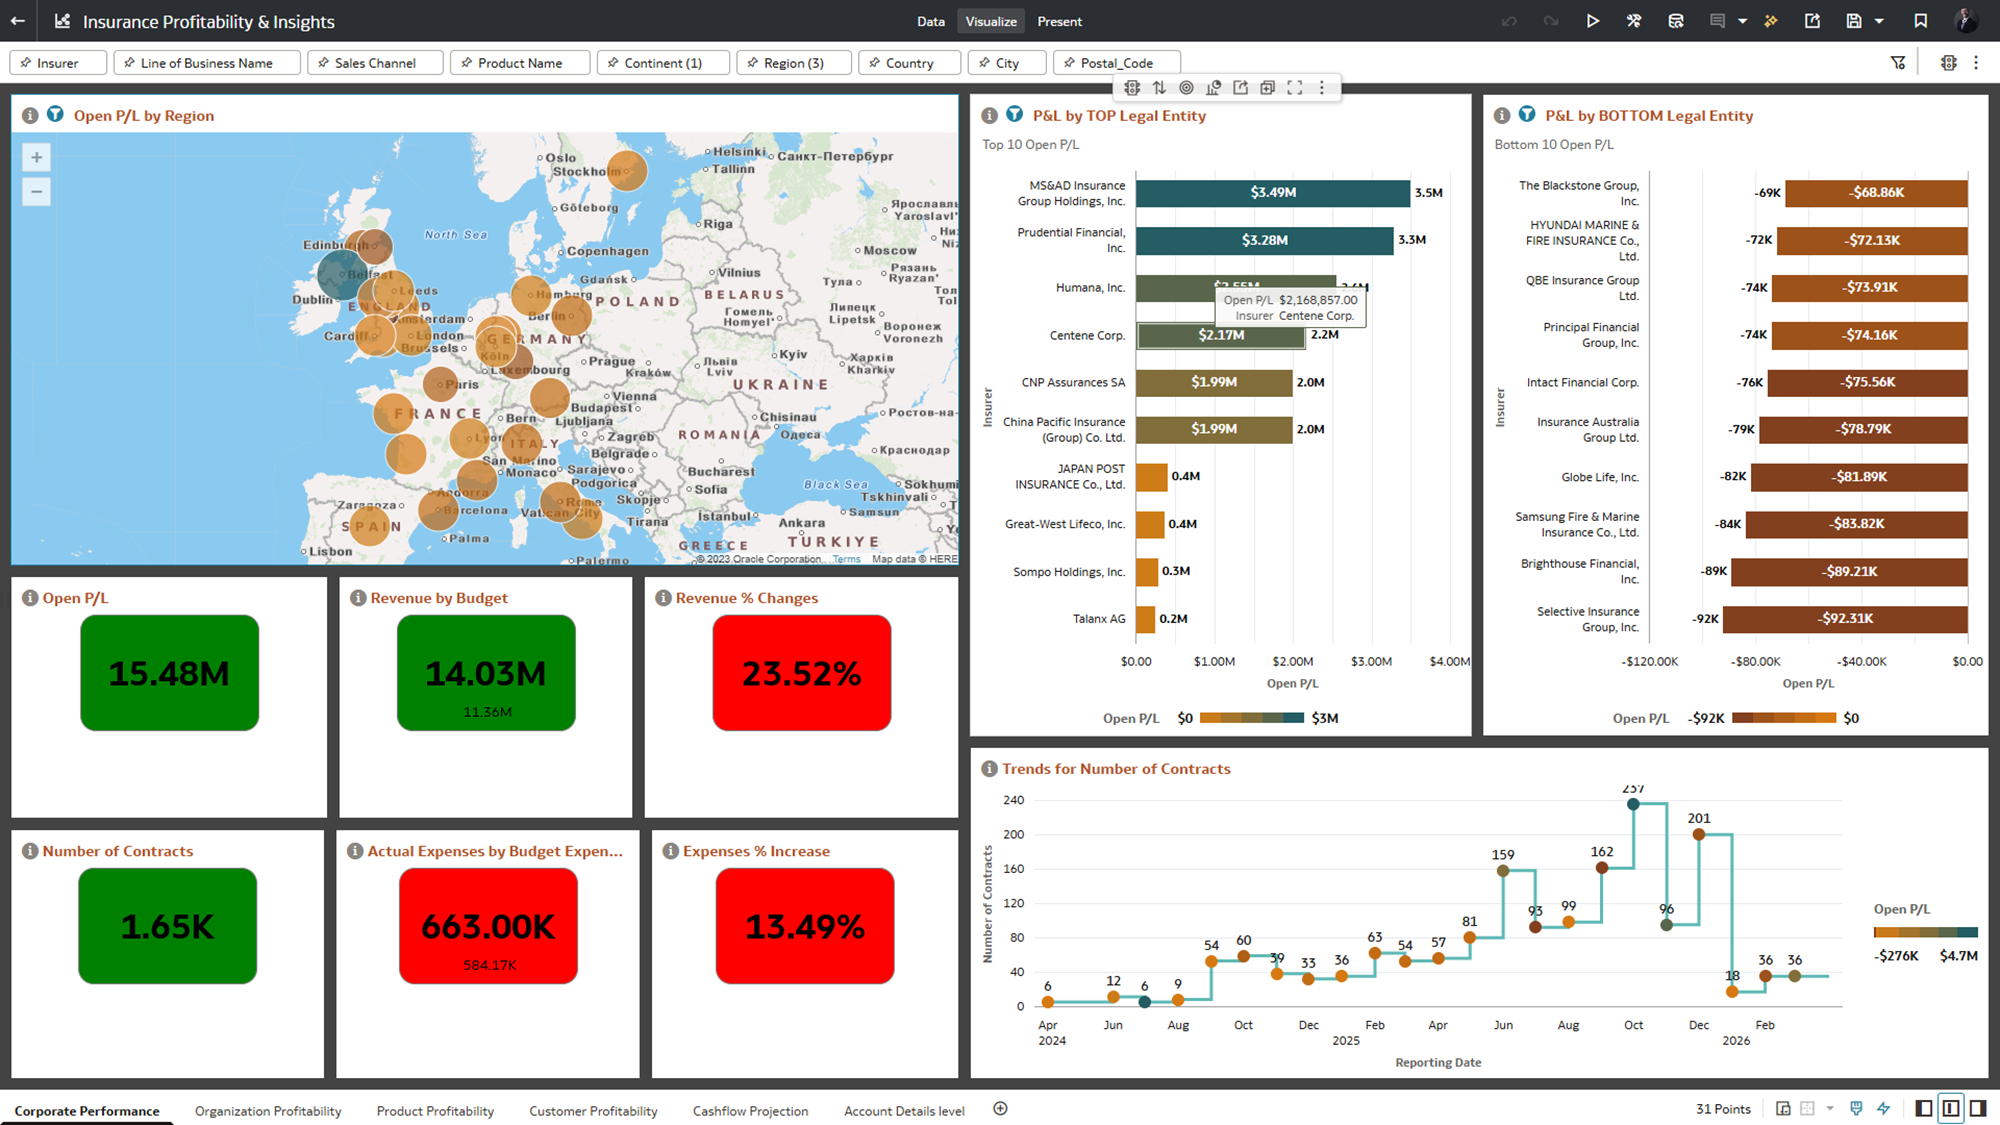
Experience insurance profitability like never before with this FSDI-powered dashboard. Seamlessly integrating diverse financial and customer data, it delivers a unified view of profitability across age, gender, region, and product lines. With clear, interactive visuals, business leaders can swiftly identify top performers, regional trends, and key growth segments, making data-driven insurance strategies easier and smarter.
Unlock deeper profitability insights, all thanks to the robust capabilities of Oracle FSDI for insurance.
1. Which dataset did you use?
Oracle Insurance Data Foundation ©
2. How did you analyze or prepare the data?
Applied use Case Analytics Ready Data Model strategy ©
3. Who is the intended audience for your visualization?
CFO's office, Relationship Managers, LoB Heads and Product Strategy.
4. What is your visualization about, and what question or problem does it address?
With clear, interactive visuals, business leaders can swiftly identify top performers, regional trends, and key growth segments, making data-driven insurance strategies easier and smarter.
5. Did you use any Oracle Analytics AI features when building your visualization (ex. AI Assistant)? If so, please describe how they were used
Yes, Analytics Assistant is new way of exploring data, is going without saying..
Use Case Driven business outcomes out of these questions:
- Can you identify the 5 insurers with the highest concentration of number of contracts decline?
- What's their open P/L contributions in the last quarter?
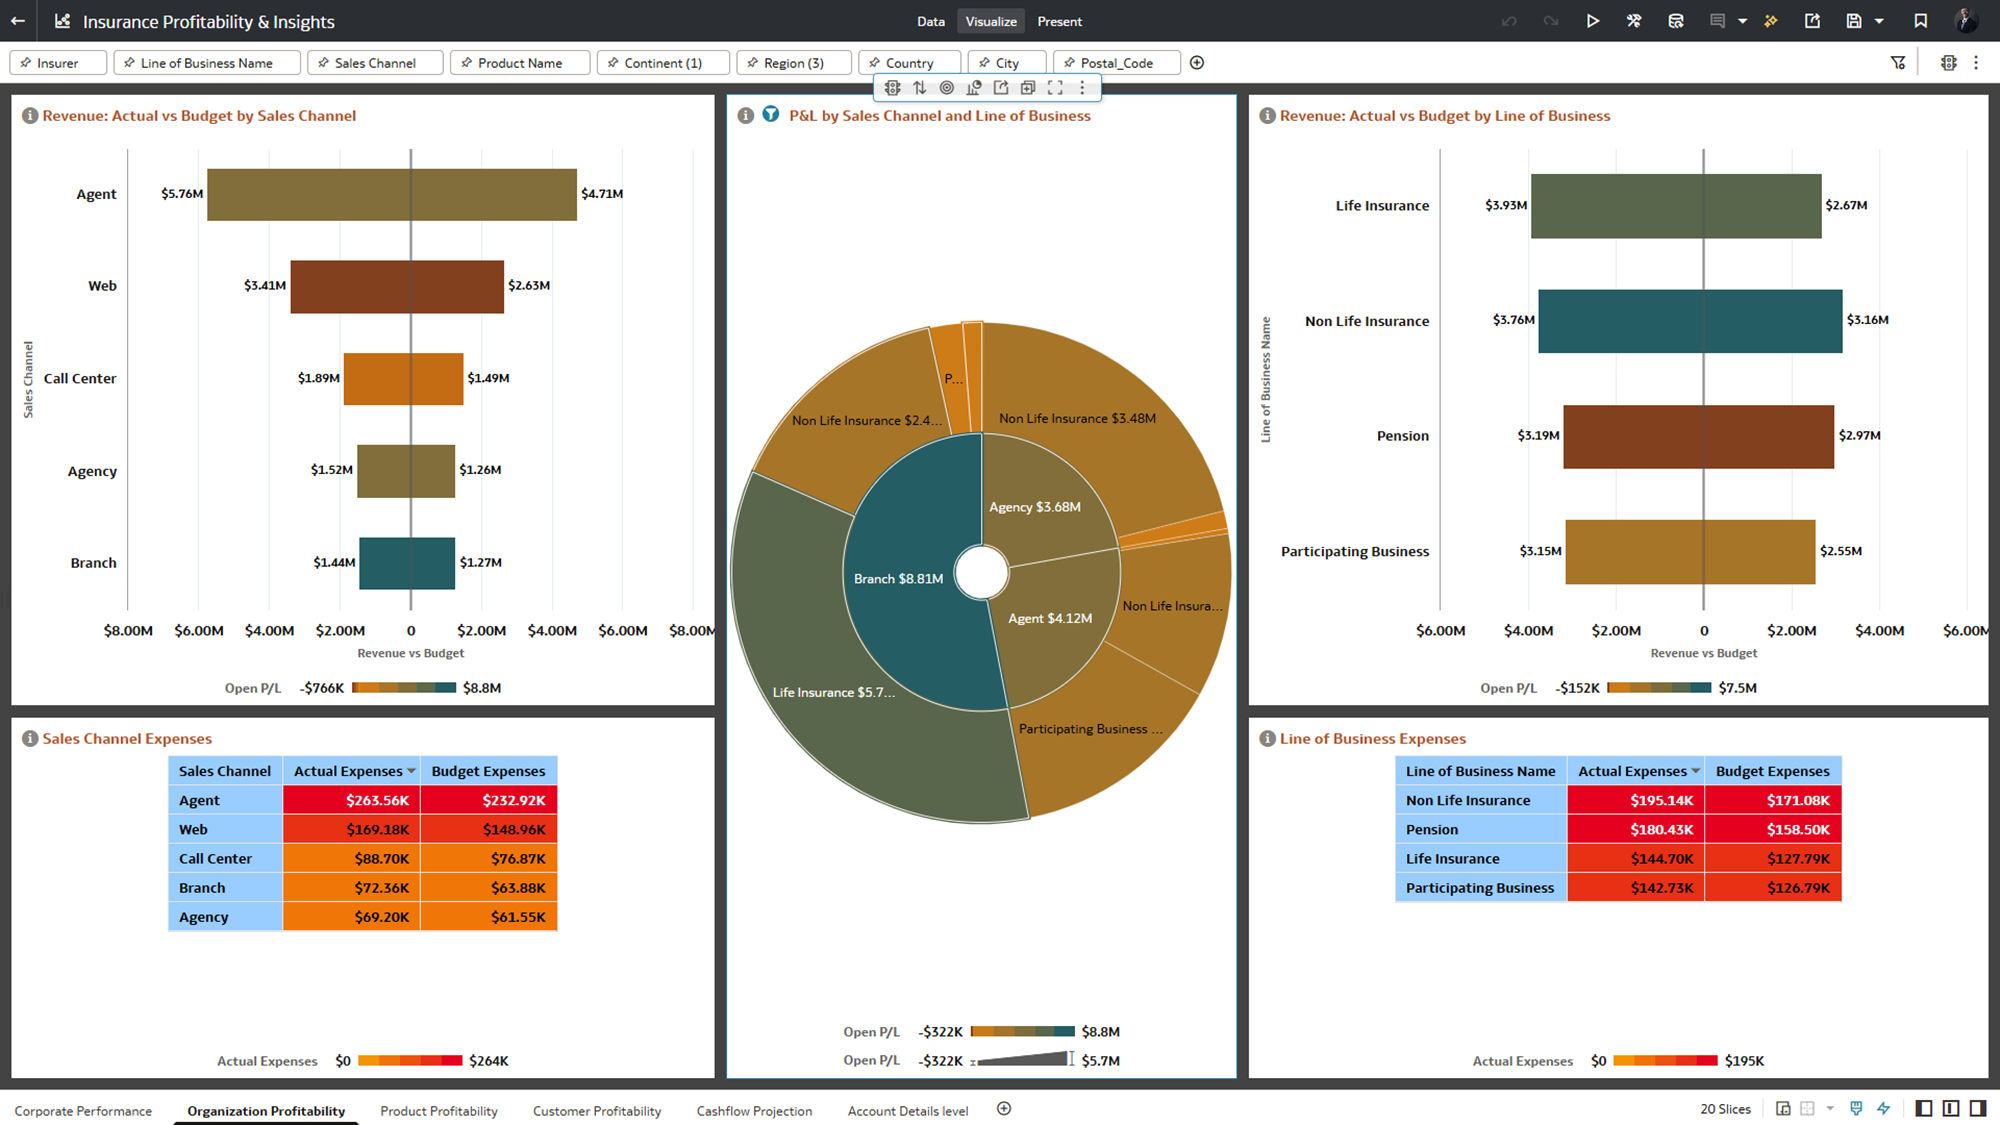
- Can you provide their channel and line of business profitability details in bar chart?
- Show the open P/L trend for Life Insurance in the Agent channel over the past few months in line chart.
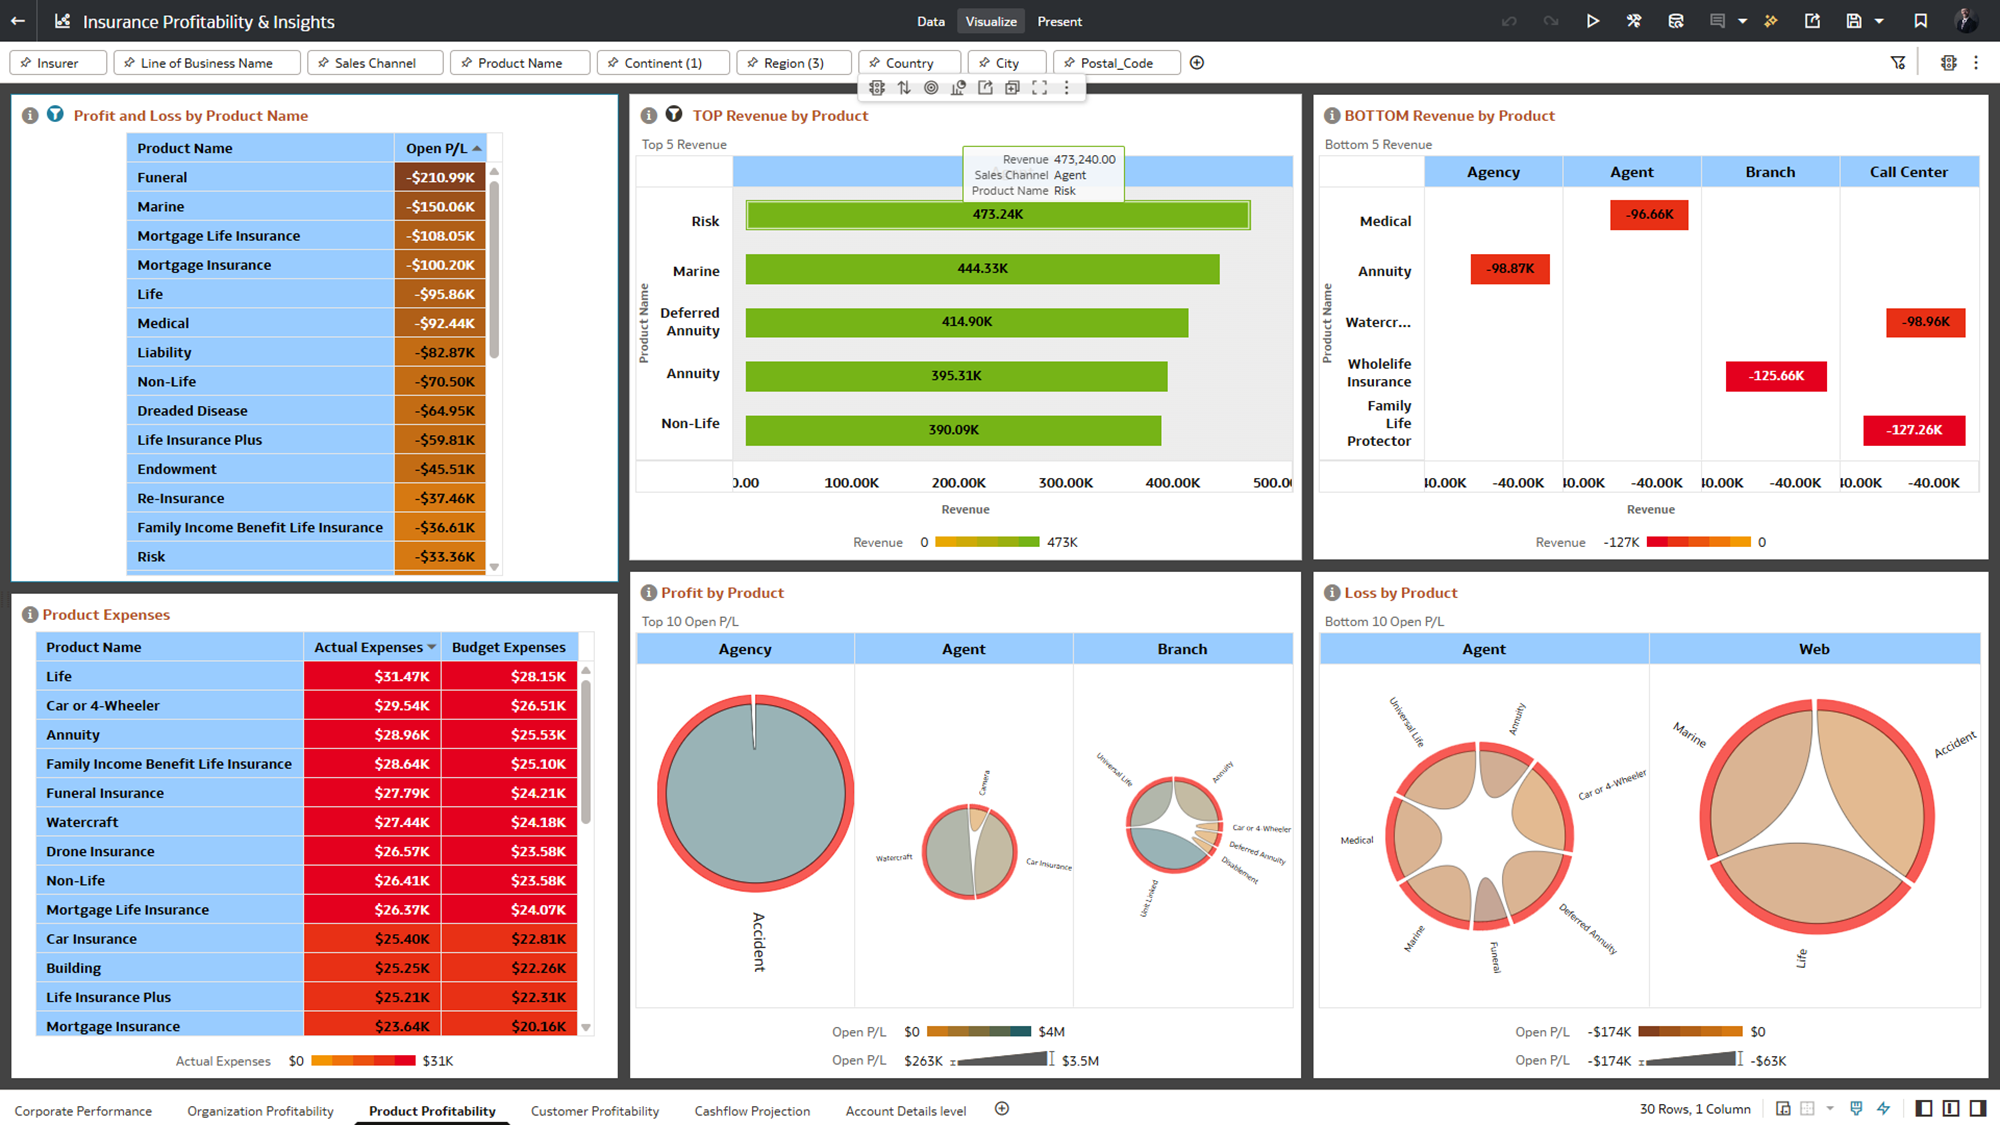
- What are the specific products profitability involved in this?
- What trends emerge when we analyze these factors by customer profession?
- Can you provide a stacked bar for the age range and gender of the least profitable 3 products and customer professions combination?
- Could you look at the exact opposite now for the most profitable set within the portfolio?
6. Did you upload your visualization image and dva file?
Completed first, © for second!