<<One Data Foundation, Many AI Insights: Powering Finance, Risk, and Customer Analytics with FSDI>>
AI-driven insights are only as good as the data behind them.
Oracle’s AI analytics solutions are powered by Financial Services Data Intelligence (FSDI) a unified, reconciled, and enterprise-grade data foundation spanning finance, risk, compliance, and customer domains.
FSDI eliminates fragmented data pipelines and inconsistent metrics, enabling trusted insights at every level, from CFO dashboards and regulatory views to customer and counterparty-level analysis.
A single AI-ready data foundation accelerates decision-making, improves transparency, and allows organizations to confidently scale AI across profitability, risk, sustainability, and customer intelligence, without sacrificing governance or trust.
1. Which dataset did you use?
Oracle Financial Services Data Foundation ©
2. How did you analyze or prepare the data?
Applied use Case Analytics Ready Data Model strategy ©
3. Who is the intended audience for your visualization?
CFO's office, Relationship Managers, LoB Heads and Product Strategy.
4. What is your visualization about, and what question or problem does it address?
FSDI eliminates fragmented data pipelines and inconsistent metrics, enabling trusted insights at every level, from CFO dashboards and regulatory views to customer and counterparty-level analysis.
5. Did you use any Oracle Analytics AI features when building your visualization (ex. AI Assistant)? If so, please describe how they were used
Yes, Analytics Assistant is new way of exploring data, is going without saying..
Use Case Driven business outcomes out of these questions:
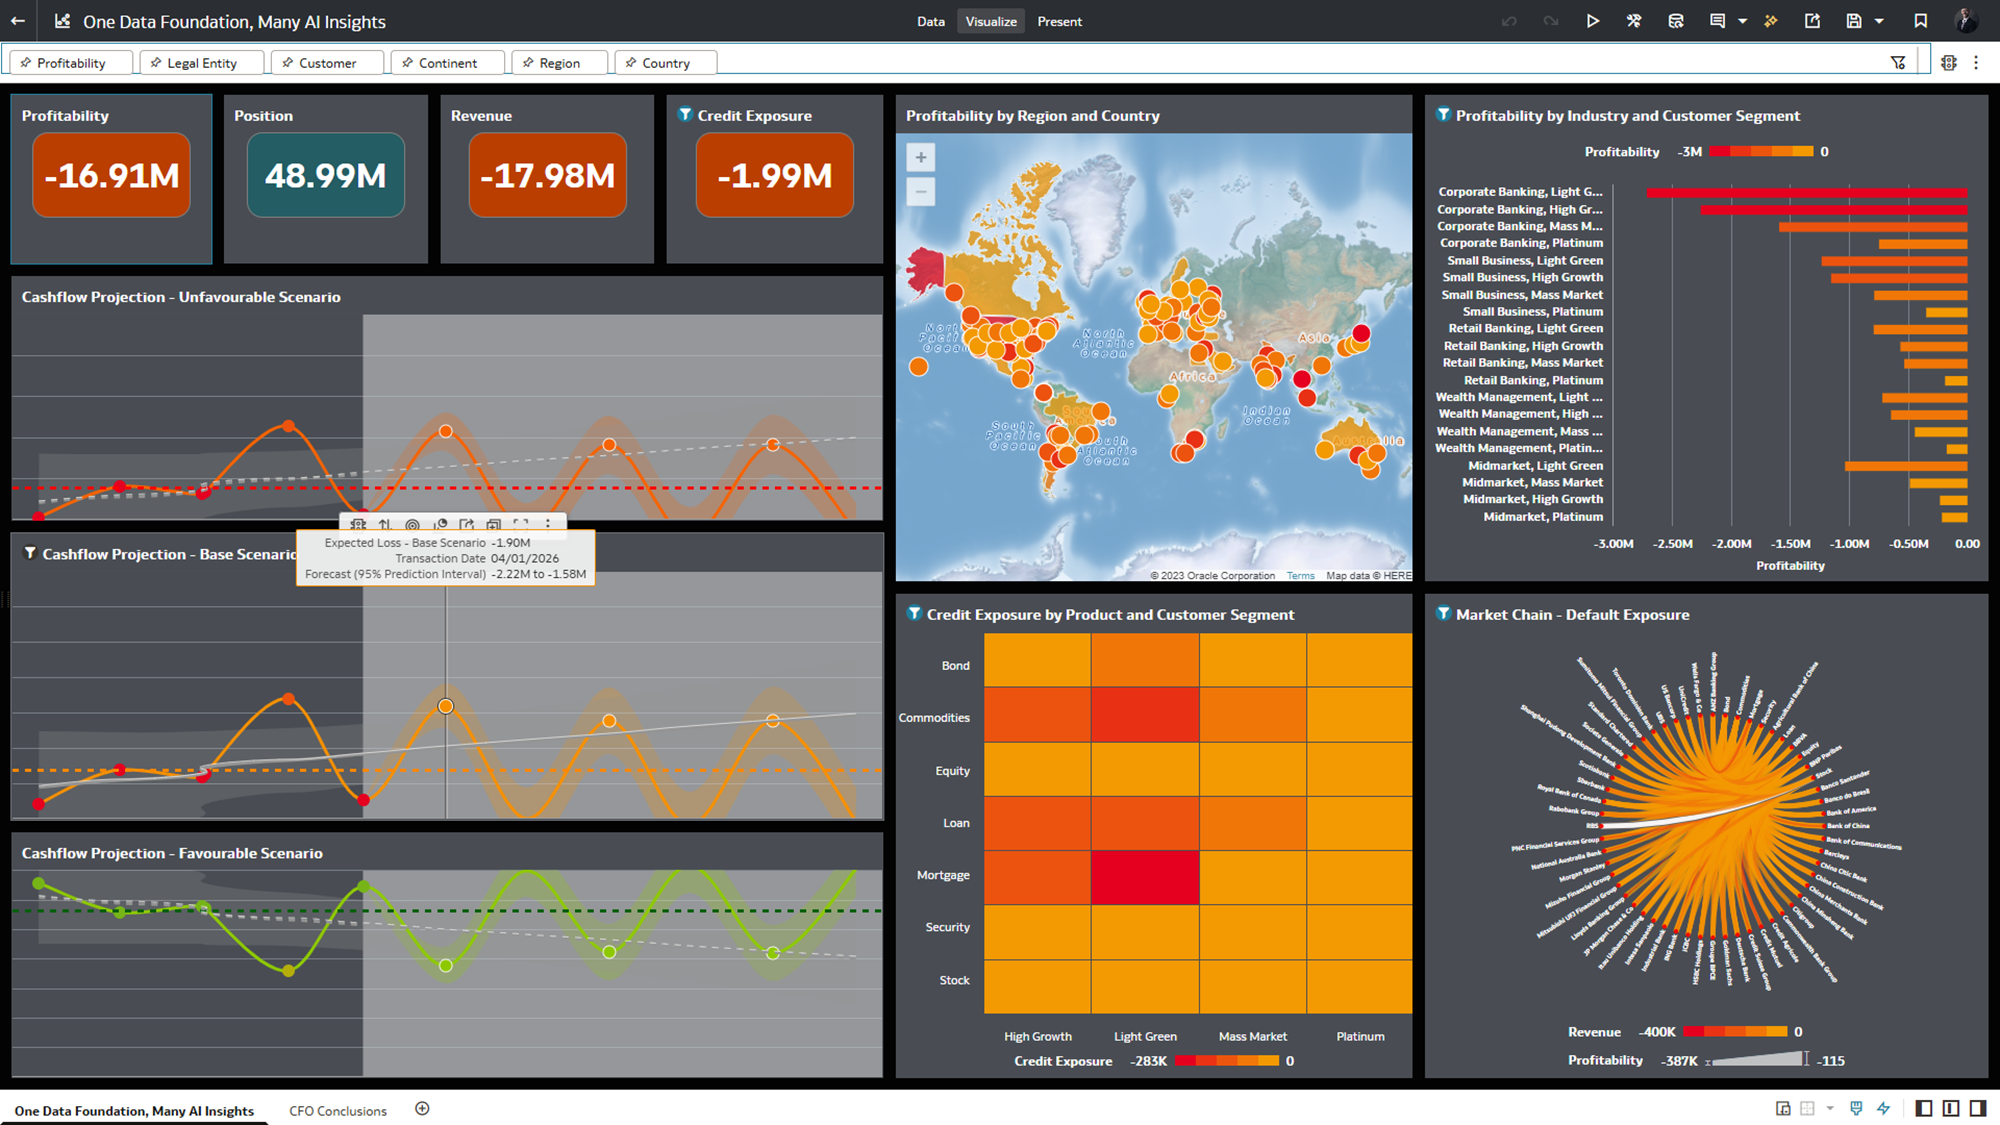
- Why did Corporate Banking profitability decline this quarter?
- Can you identify the products and segments with credit exposure driving this decline?
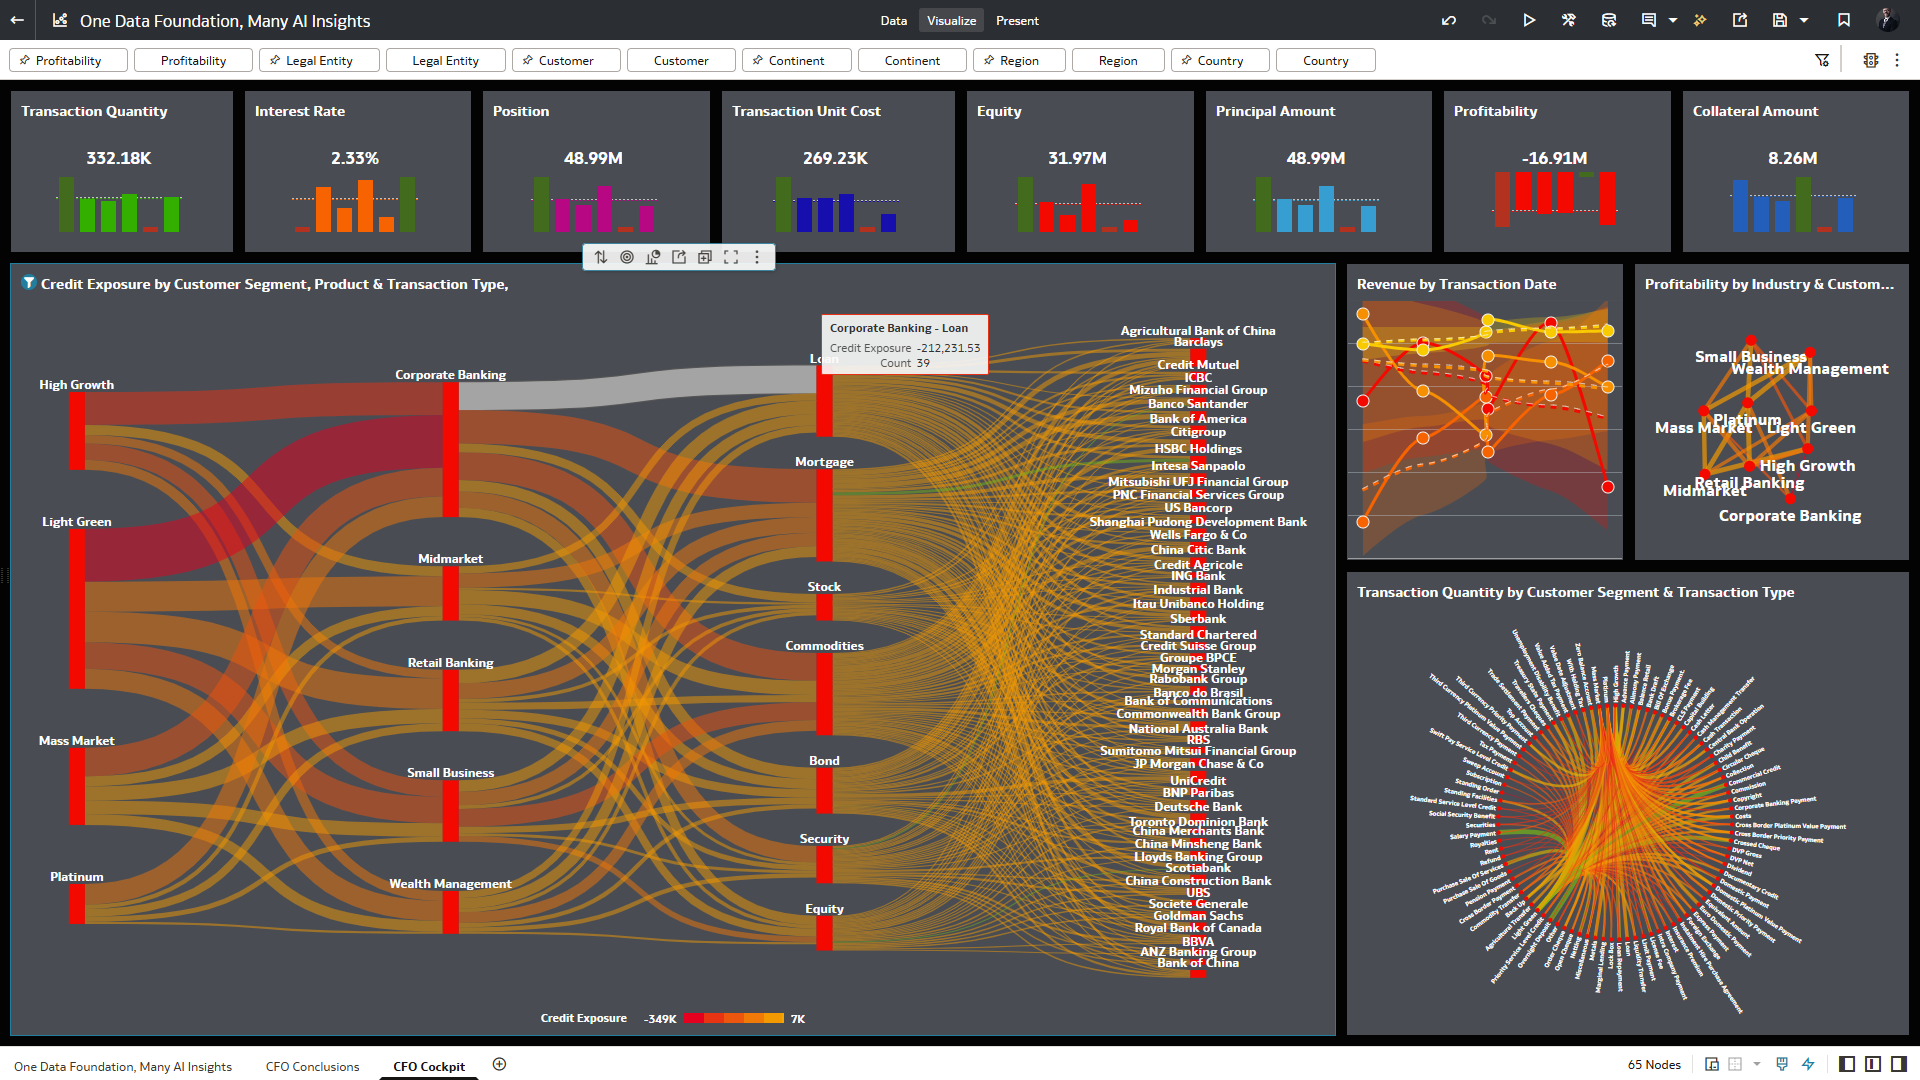
- Show me the top contributing customers for this mortgage subset.
- Are there customers contributing to increasing profitability but rising credit exposure?
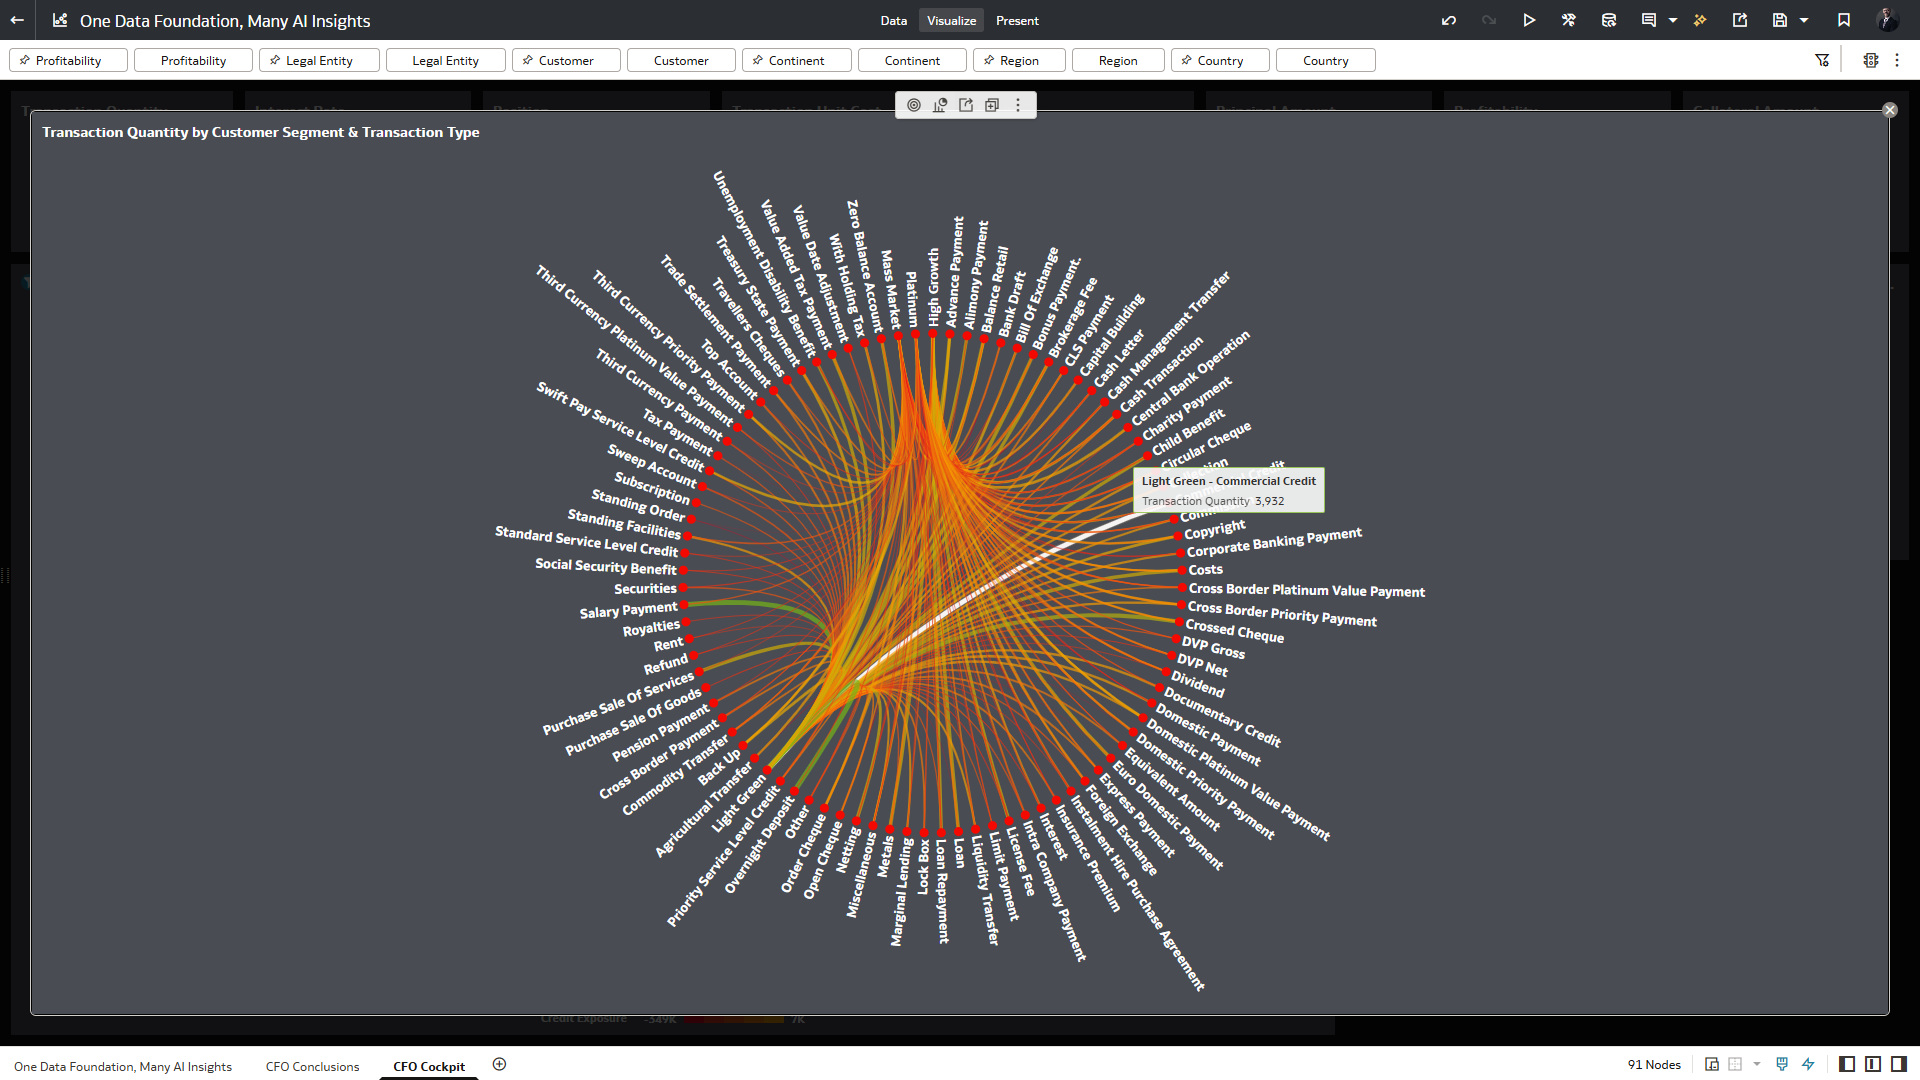
- Can you isolate Mass Market customer segment and breaking that down by Customer Segment and Region?
- Add Country and City and showing me results in Map chart?
- Compare this now for all products and Industries in pie chart.
6. Did you upload your visualization image and dva file?
Completed first, © for second!