Hello experts,
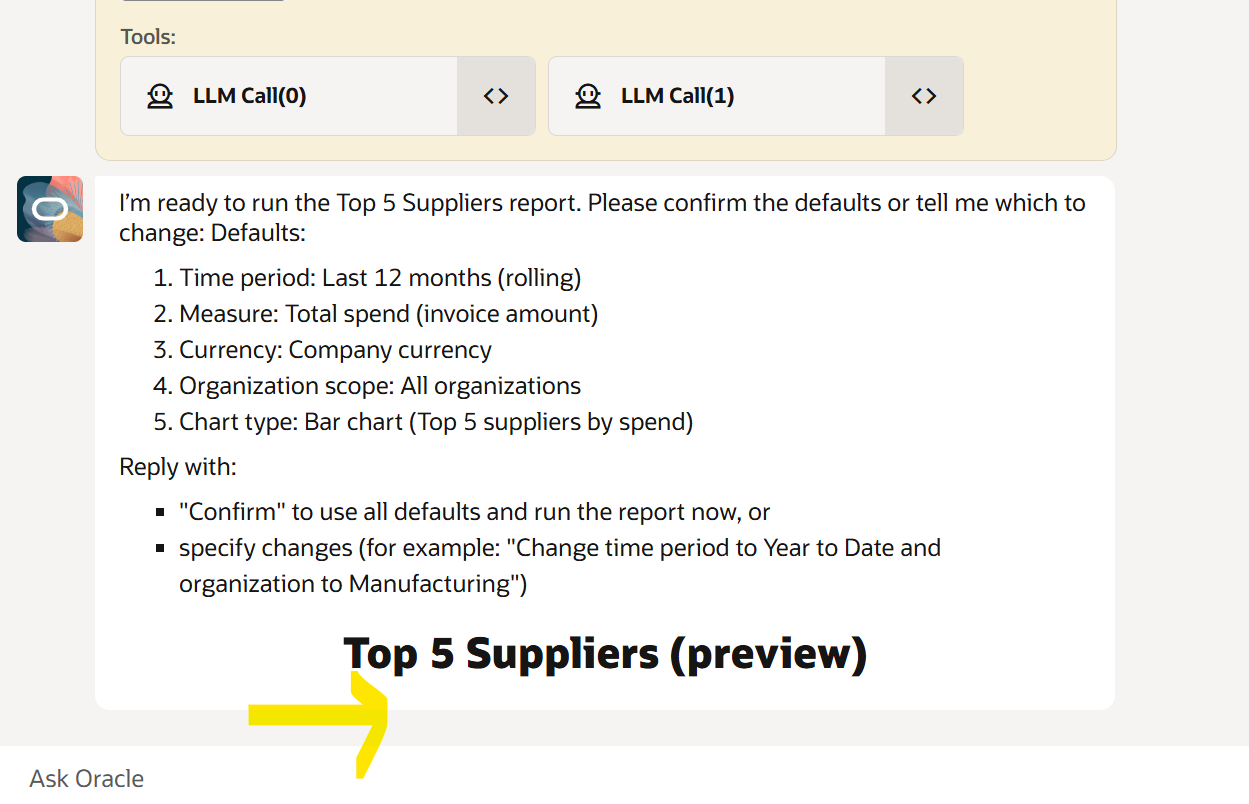
I need to generate output from an OTBI analysis in the form of a Pie chart, in Oracle Fusion AI Agent Studio.
I'm trying to leverage SVG Charts using LLM Prompts. But its not working as expected.
Ex: (Agent Prompt in LLM)
******************************************************************************************************************************
You are to provide an SVG (no javascript) pie chart, display all Hold Totals as slices of the pie.
chart format:
- Wrap the SVG chart into a div and maximize the real estate available to you
- Title: Hold Totals as h4
- Include a legend with color code below the chart, with each item vertically stacked. Add a margin or padding between with the chart to avoid overlapping
- Ensure the chart is clear and visible (for example size 525 x 525 viewBox="0 0 400 420" and width: -webkit-fill-available;)
- Add the total number of holds at the center of the pie
- Ensure percentages are centered if any are displayed
********************************************************************************************************
But the Agent is not able to convert the SVG components into chart, where as Legend comes up fine as you see below.
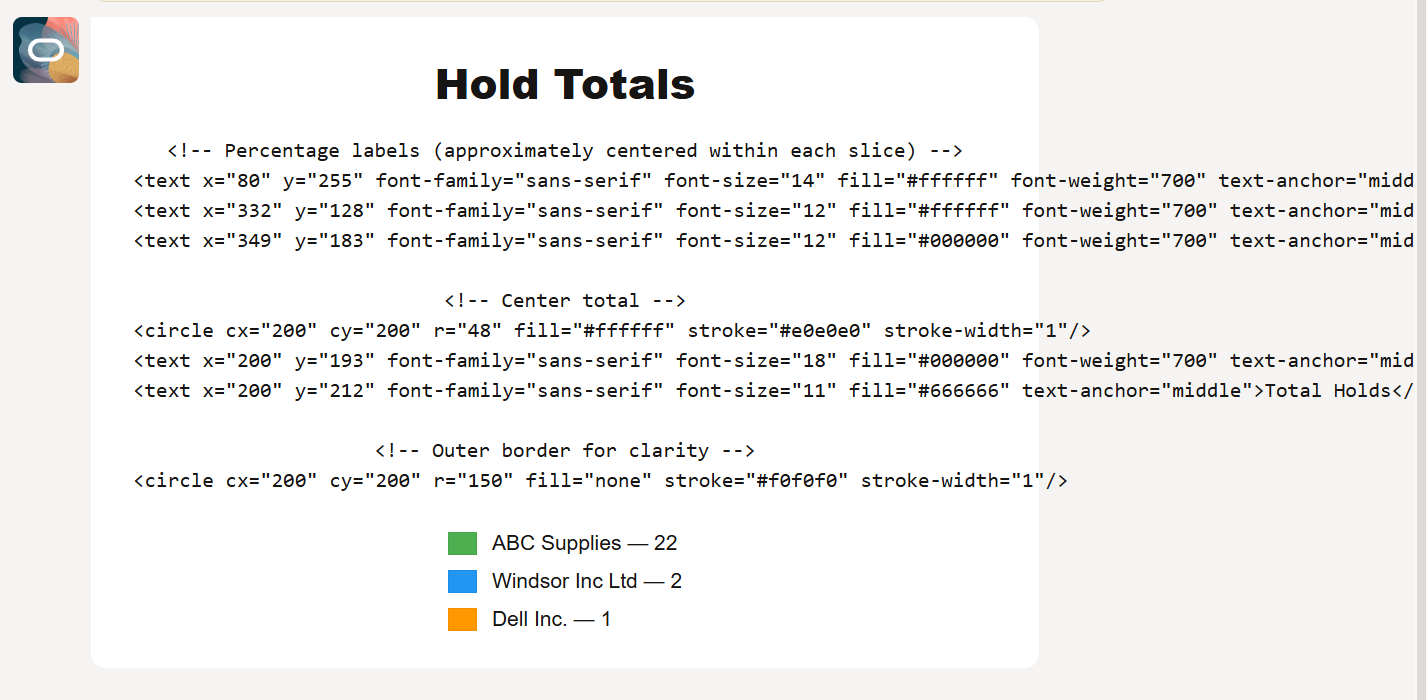
The LLM generated tags are as below: (Tried giving an Example as below in the custom LLM Prompt as well - instead of instructions in plain text/along with it)
<div style="width: 100%; max-width: 600px; box-sizing: border-box; padding: 12px; text-align: center;">
<h4 style="margin: 6px 0 12px 0; font-family: sans-serif;">Hold Totals</h4>
<svg viewBox="0 0 400 400" width="100%" xmlns="http://www.w3.org/2000/svg" style="max-width:100%; display:block; margin:0 auto 12px;">
<!-- Pie center at (200,200), radius 140 -->
<!-- Slices (using three paths) -->
<!-- ABC Supplies: value 22 (88%) — large slice -->
<path d="M200 200 L340 200 A140 140 0 1 1 116.655 84.387 Z" fill="#4CAF50" stroke="#ffffff" stroke-width="1"/>
<!-- Windsor Inc Ltd: value 2 (8%) -->
<path d="M200 200 L116.655 84.387 A140 140 0 0 1 161.524 266.582 Z" fill="#2196F3" stroke="#ffffff" stroke-width="1"/>
<!-- Dell Inc.: value 1 (4%) -->
<path d="M200 200 L161.524 266.582 A140 140 0 0 1 340 200 Z" fill="#FF9800" stroke="#ffffff" stroke-width="1"/>
<!-- Percentage labels (approx. centered within each slice) -->
<text x="106" y="150" font-family="sans-serif" font-size="12" fill="#ffffff" font-weight="700" text-anchor="middle">88.0%</text>
<text x="146" y="236" font-family="sans-serif" font-size="10" fill="#ffffff" font-weight="700" text-anchor="middle">8.0%</text>
<text x="267" y="236" font-family="sans-serif" font-size="10" fill="#ffffff" font-weight="700" text-anchor="middle">4.0%</text>

<!-- Outer circle border for clarity -->
<circle cx="200" cy="200" r="140" fill="none" stroke="#e0e0e0" stroke-width="1"/>
</svg> <!-- Legend: vertically stacked, spaced from chart --> <div style="display: inline-block; text-align: left; padding-top: 8px; font-family: sans-serif;">
<div style="display:flex; align-items:center; margin-bottom:8px;">
<div style="width:18px; height:14px; background:#4CAF50; margin-right:10px; border:1px solid rgba(0,0,0,0.06)"></div>
<div style="font-size:14px;">ABC Supplies — 22</div>
</div>
<div style="display:flex; align-items:center; margin-bottom:8px;">
<div style="width:18px; height:14px; background:#2196F3; margin-right:10px; border:1px solid rgba(0,0,0,0.06)"></div>
<div style="font-size:14px;">Windsor Inc Ltd — 2</div>
</div>
<div style="display:flex; align-items:center;">
<div style="width:18px; height:14px; background:#FF9800; margin-right:10px; border:1px solid rgba(0,0,0,0.06)"></div>
<div style="font-size:14px;">Dell Inc. — 1</div>
</div>
</div>
</div>
Tried using a 3 card approach and it worked. But I wanted to work this out with SVG. Any help is much appreciated!!
Thanks