- Which dataset did you use?
We used the Flight schedule, Flight costs dataset as the core source for the aviation dashboard, along with the supporting dimensional structures. - How did you analyze or prepare the data?
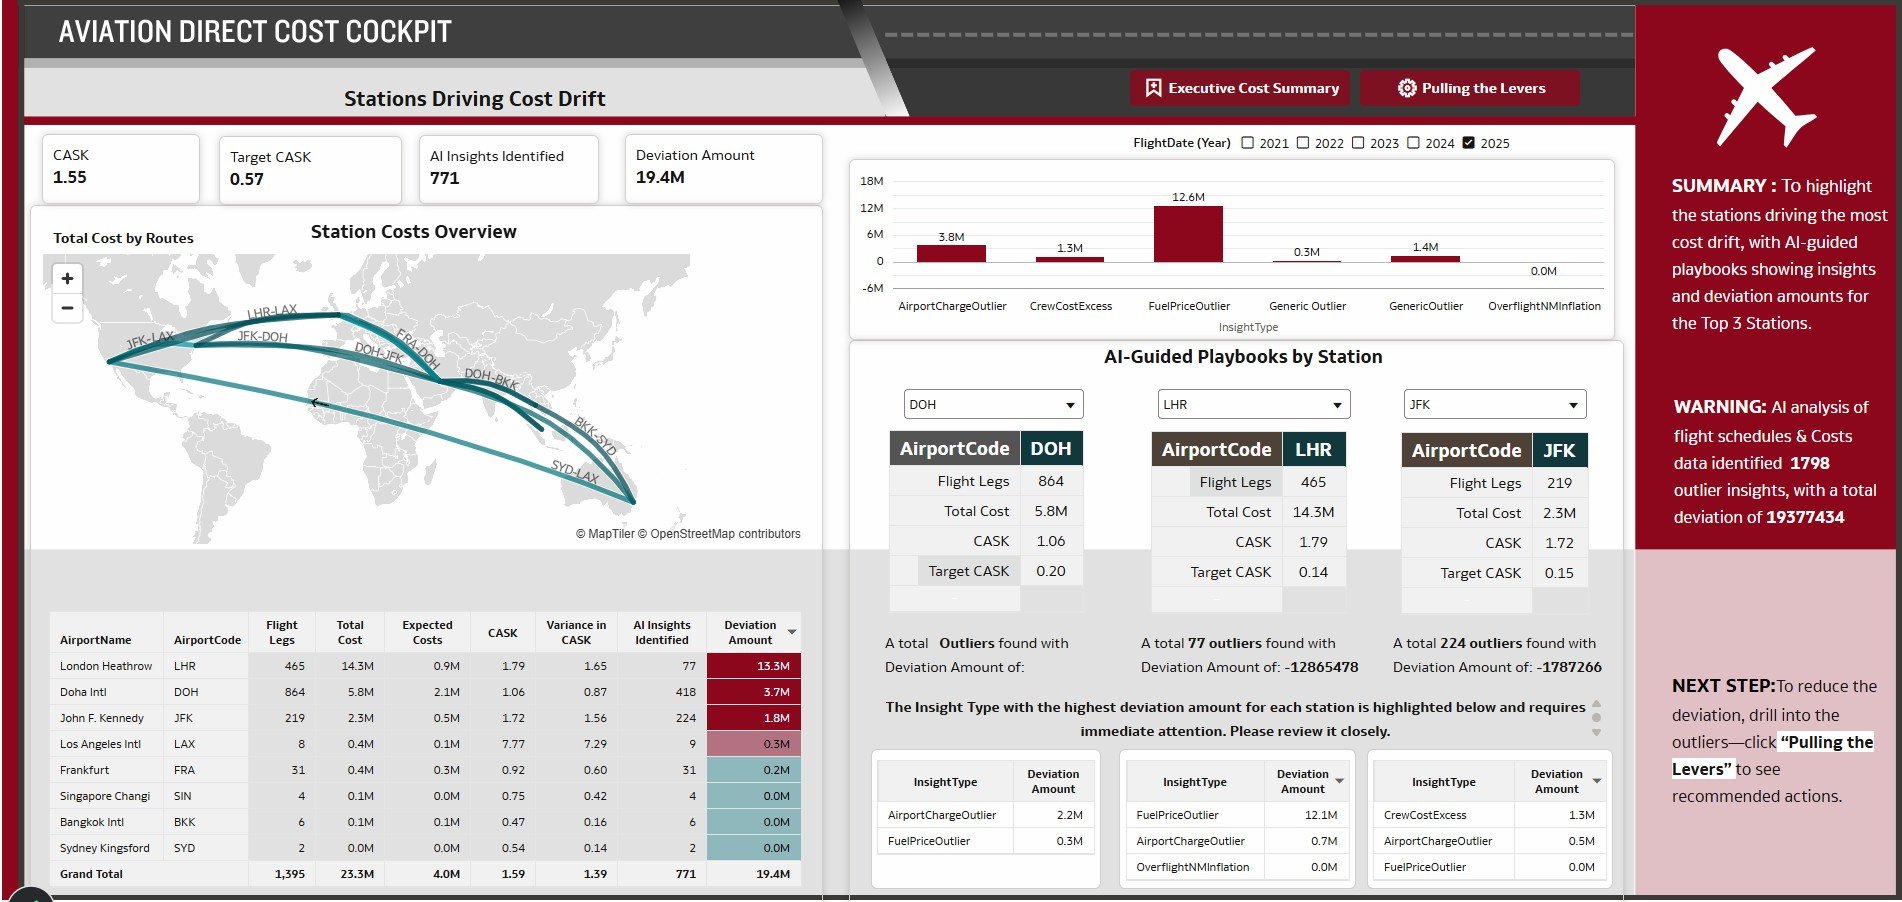
We analyzed the data using semantic search and also used OAC AI Insights to extract relevant facts and pattern matching to identify top outliers, deviation amounts, and cost categories from FactFlightCost, FactFlightSchedule. The dataset we created itself stores AI insights related to aviations costs which helps find anomalies and patterns. - Who is the intended audience for your visualization?
The intended audience is airline executives – particularly VP Finance, Network Planning, Station Managers, and Procurement leads – who need to quickly grasp cost drift patterns, prioritize AI‑flagged opportunities, and act on recommendations to recover savings and control CASK across the network. - What is your visualization about, and what question or problem does it address?
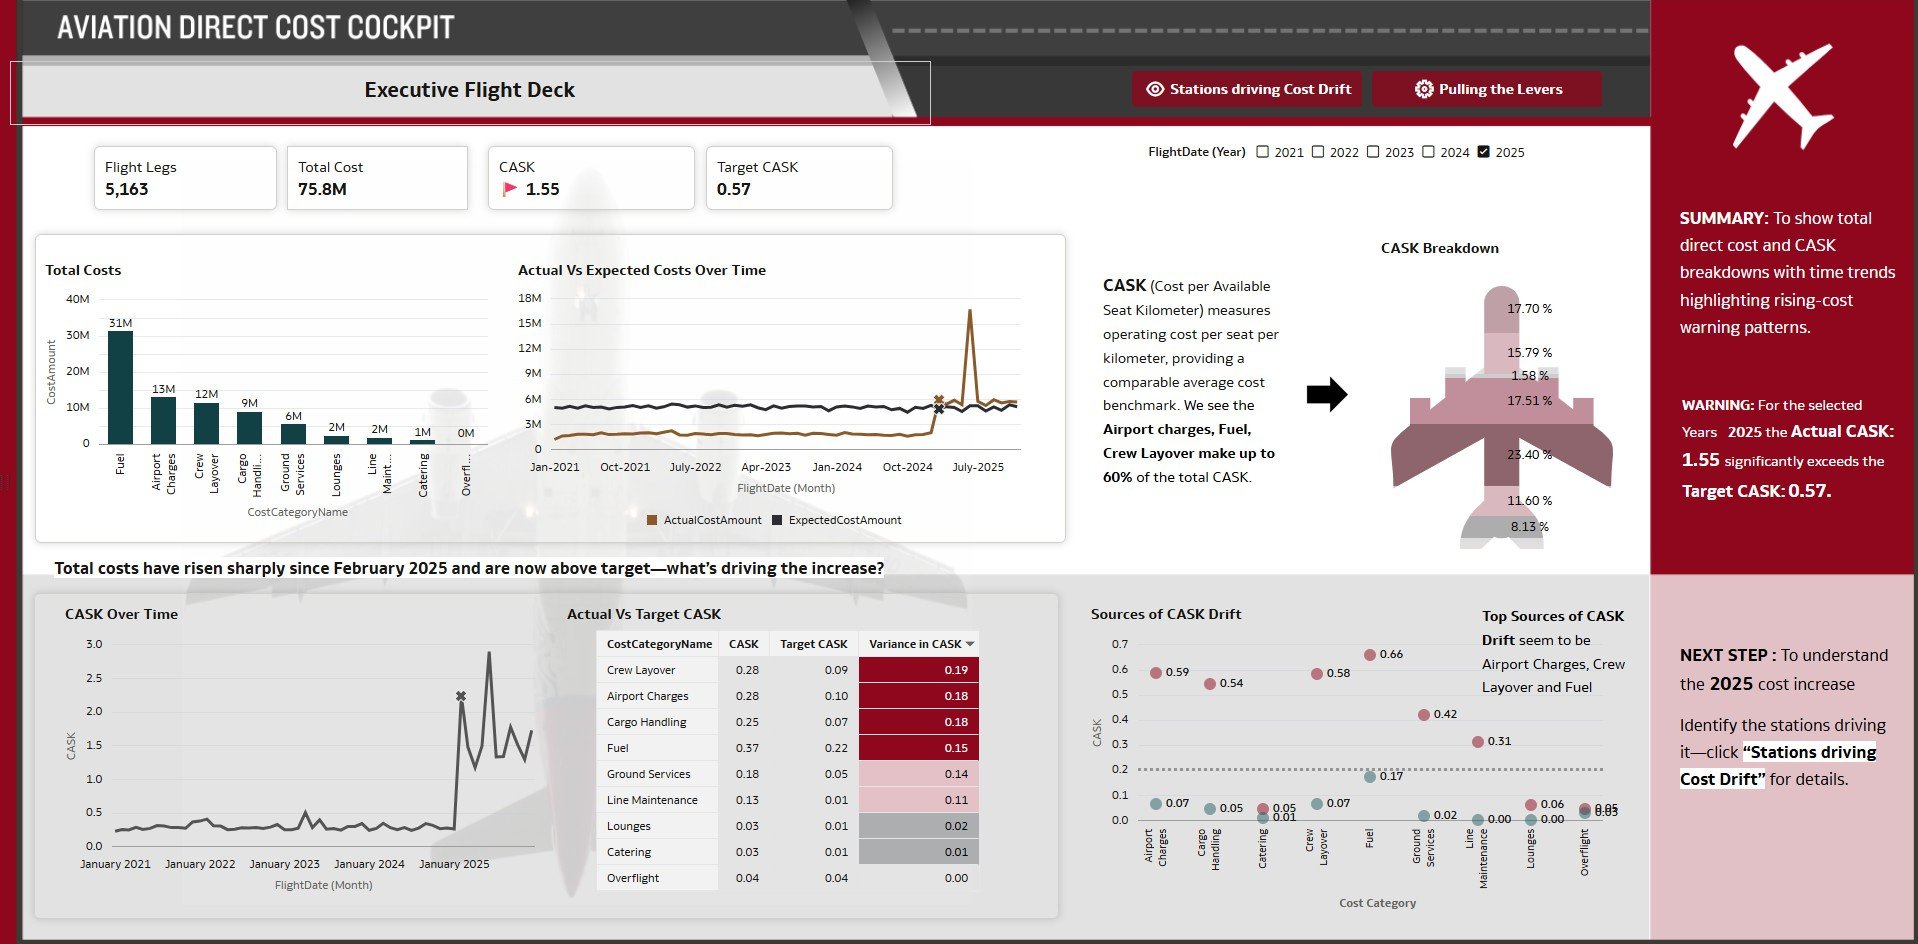
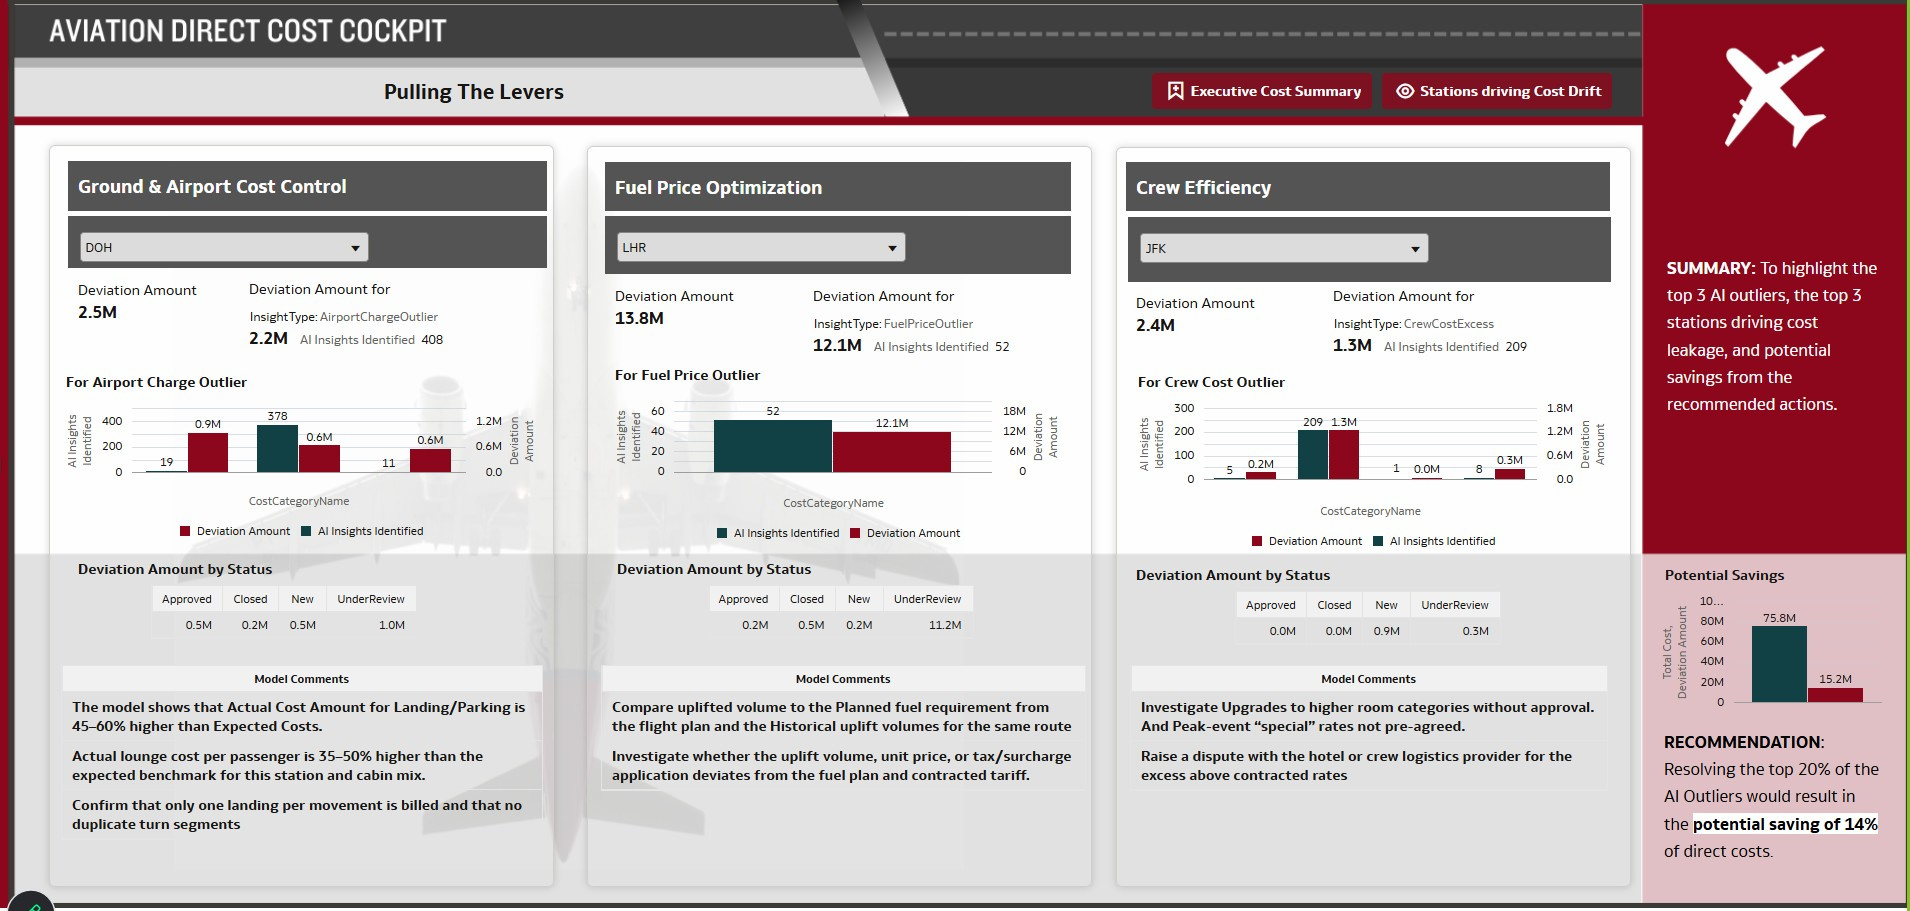
The Aviation Direct Cost Cockpit dashboard tells a story of how the network’s flight costs and CASK have drifted over time, highlighting where the operation has become expensive and unreliable. It uses AI‑flagged outliers across airport charges, fuel, crew layovers, lounges, and cargo handling to pinpoint the routes, stations, and suppliers generating the biggest savings opportunities. - Did you use any Oracle Analytics AI features when building your visualization (ex. AI Assistant)? If so, please describe how they were used.
Yes we used AI Assistant on top of the data after indexing the dataset to query and explore the patterns of the data with natural language.
Adding all pages of the Viz here below.
This Viz is created and submitted by - Amrita.gupta@oracle.com & Jahnavi.kumari@oracle.com
Aviation Direct Cost Cockpit.dva


