1. Which dataset did you use?
I used a Procurement Spend Transaction dataset, which includes procurement records such as Transaction ID, Supplier Name, Category, Cost Center, Item Code, Item Description, Quantity, Unit Price, Spend Amount, Agreement Flag, and Invoice Date.
The dataset represents procurement activities across departments and suppliers.
2. How did you analyze or prepare the data?
I analyzed the data using Oracle Analytics Cloud (OAC) by applying filtering, aggregation, and calculated metrics.
Key analytical steps included:
Filtering procurement records by supplier, category, and agreement status
Aggregating spending metrics such as total spend, average unit price, and total quantity purchased
Calculated metrics such as:
Total Spend Amount by Supplier and Category
Average Unit Price comparison across suppliers
Agreement-based procurement percentage
Category contribution to total spend
Cost center procurement share
Supplier concentration analysis
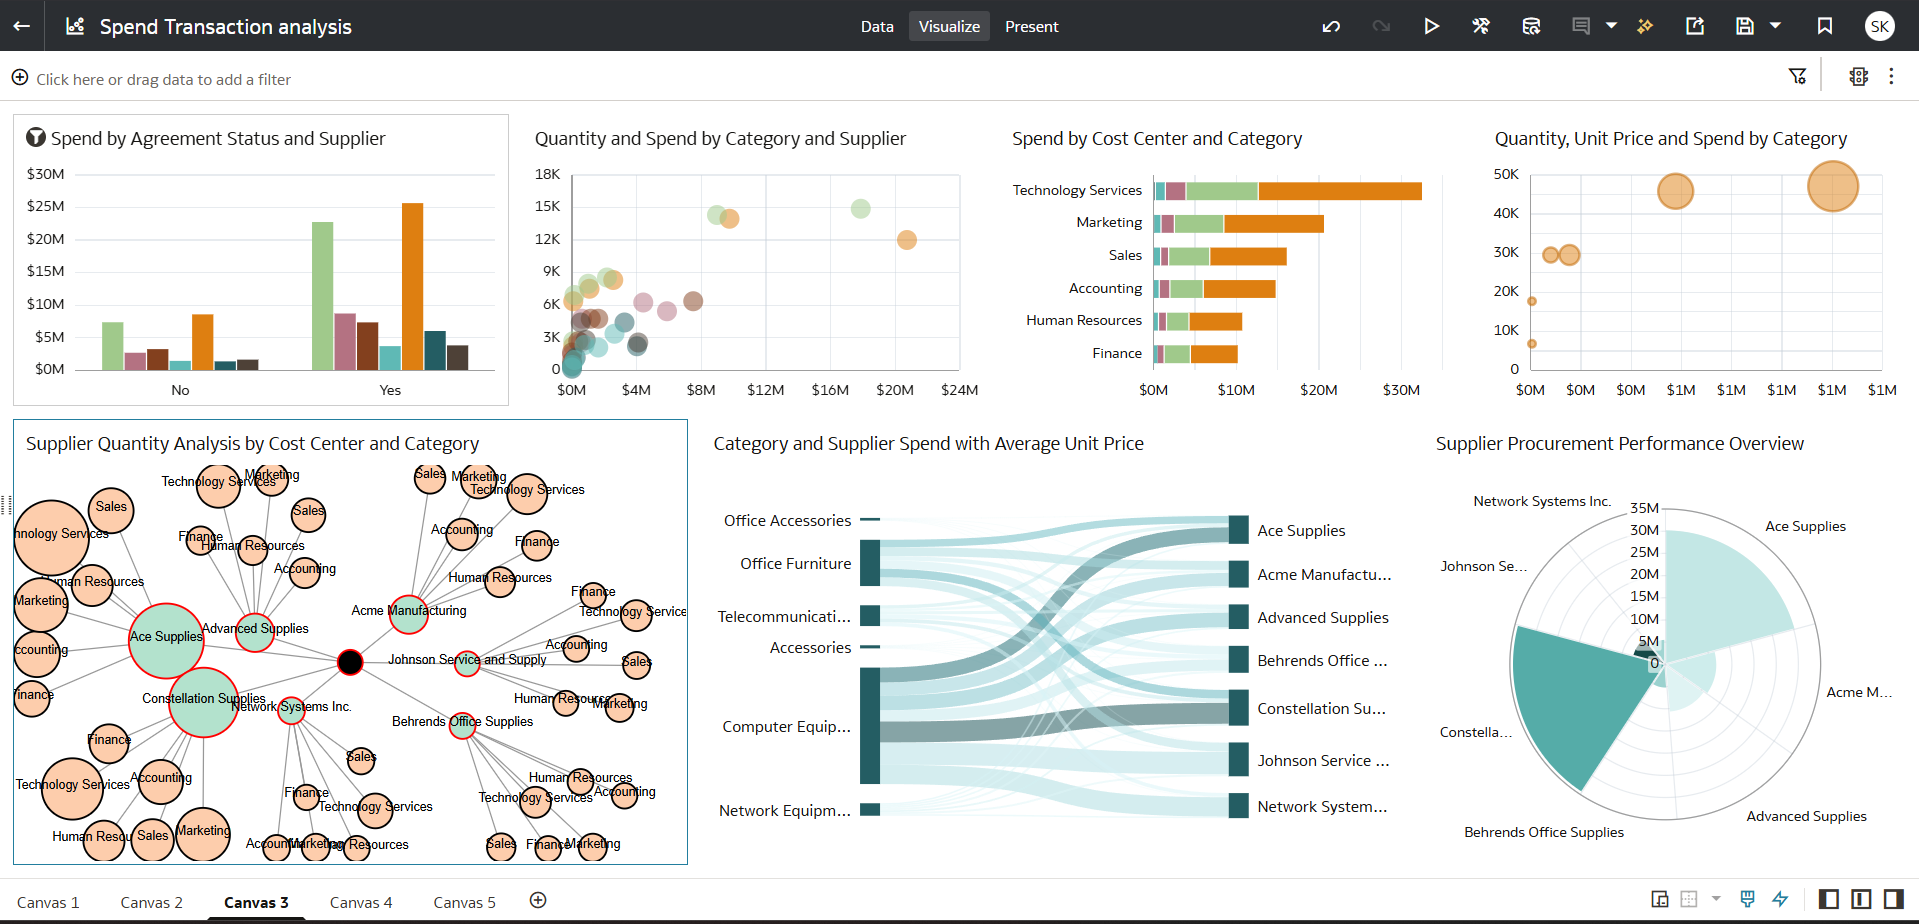
I also used hierarchical grouping across Supplier → Category → Cost Center → Item → Time to perform multi-level procurement analysis.
3. Who is the intended audience for your visualization?
The intended audience includes:
Procurement Managers
Supply Chain Analysts
Finance and Cost Control Teams
Business Operations Managers
Strategic Sourcing Teams
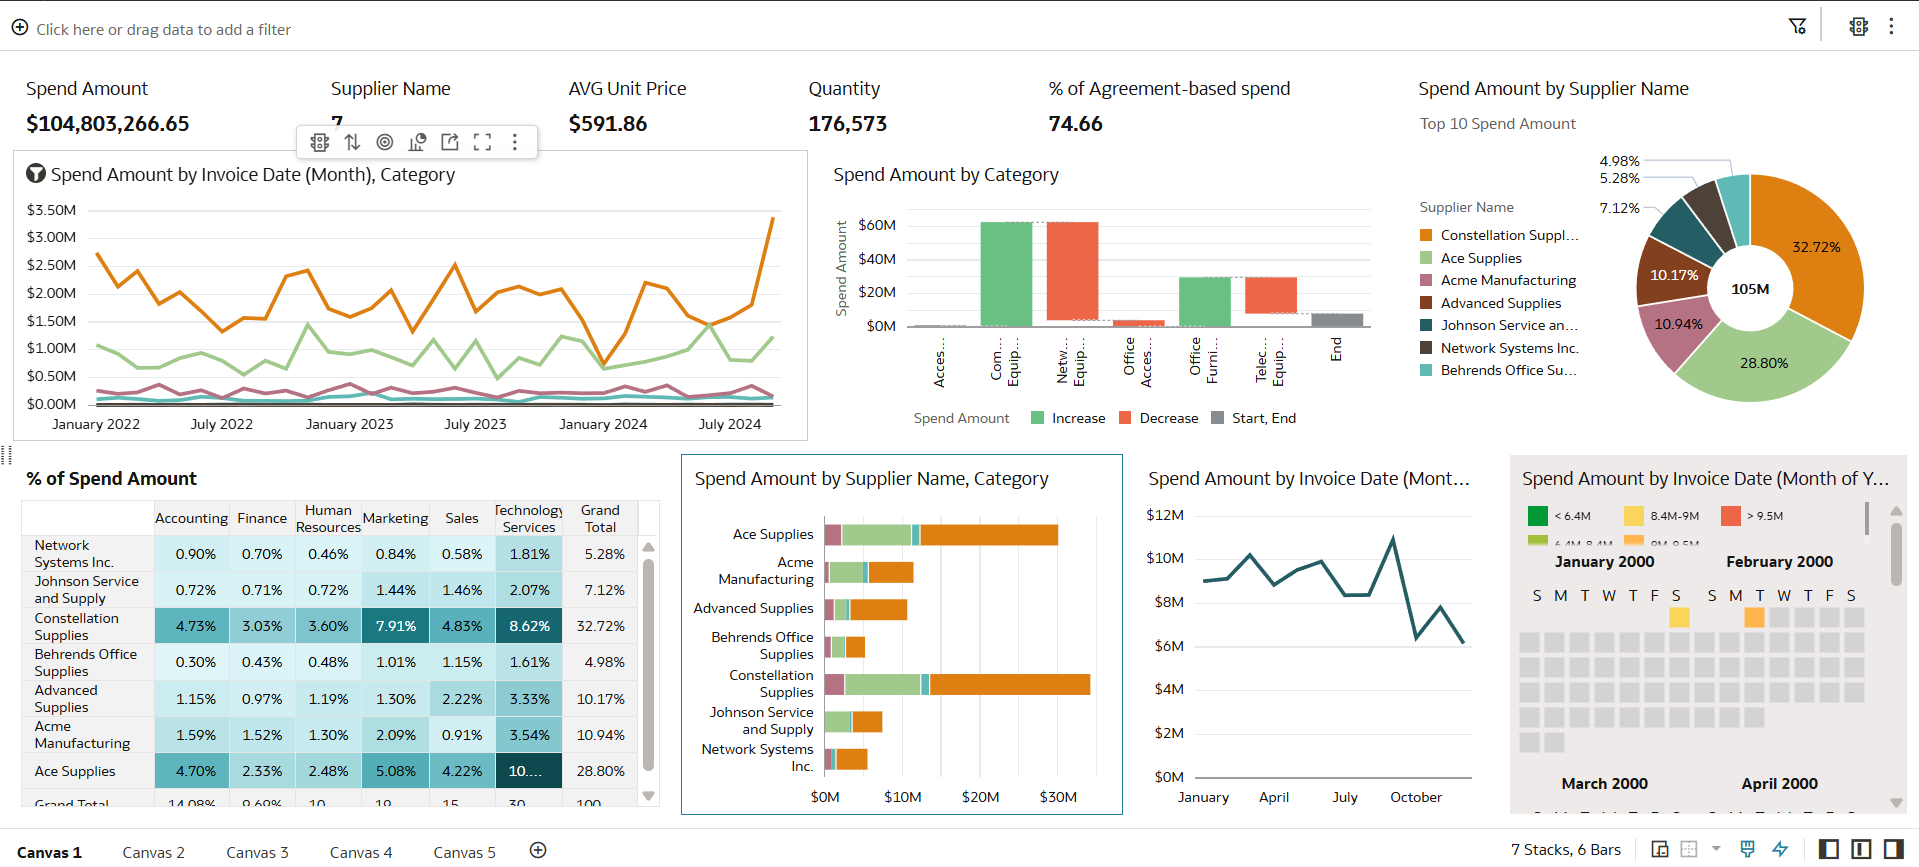
4. What is your visualization about, and what question or problem does it address?
The visualization focuses on procurement spend analysis and supplier performance monitoring.
It helps answer key procurement questions such as:
Which suppliers contribute the highest procurement spending?
Which categories drive the majority of purchasing costs?
Which departments (cost centers) are responsible for the largest procurement volume?
How does procurement spending change over time?
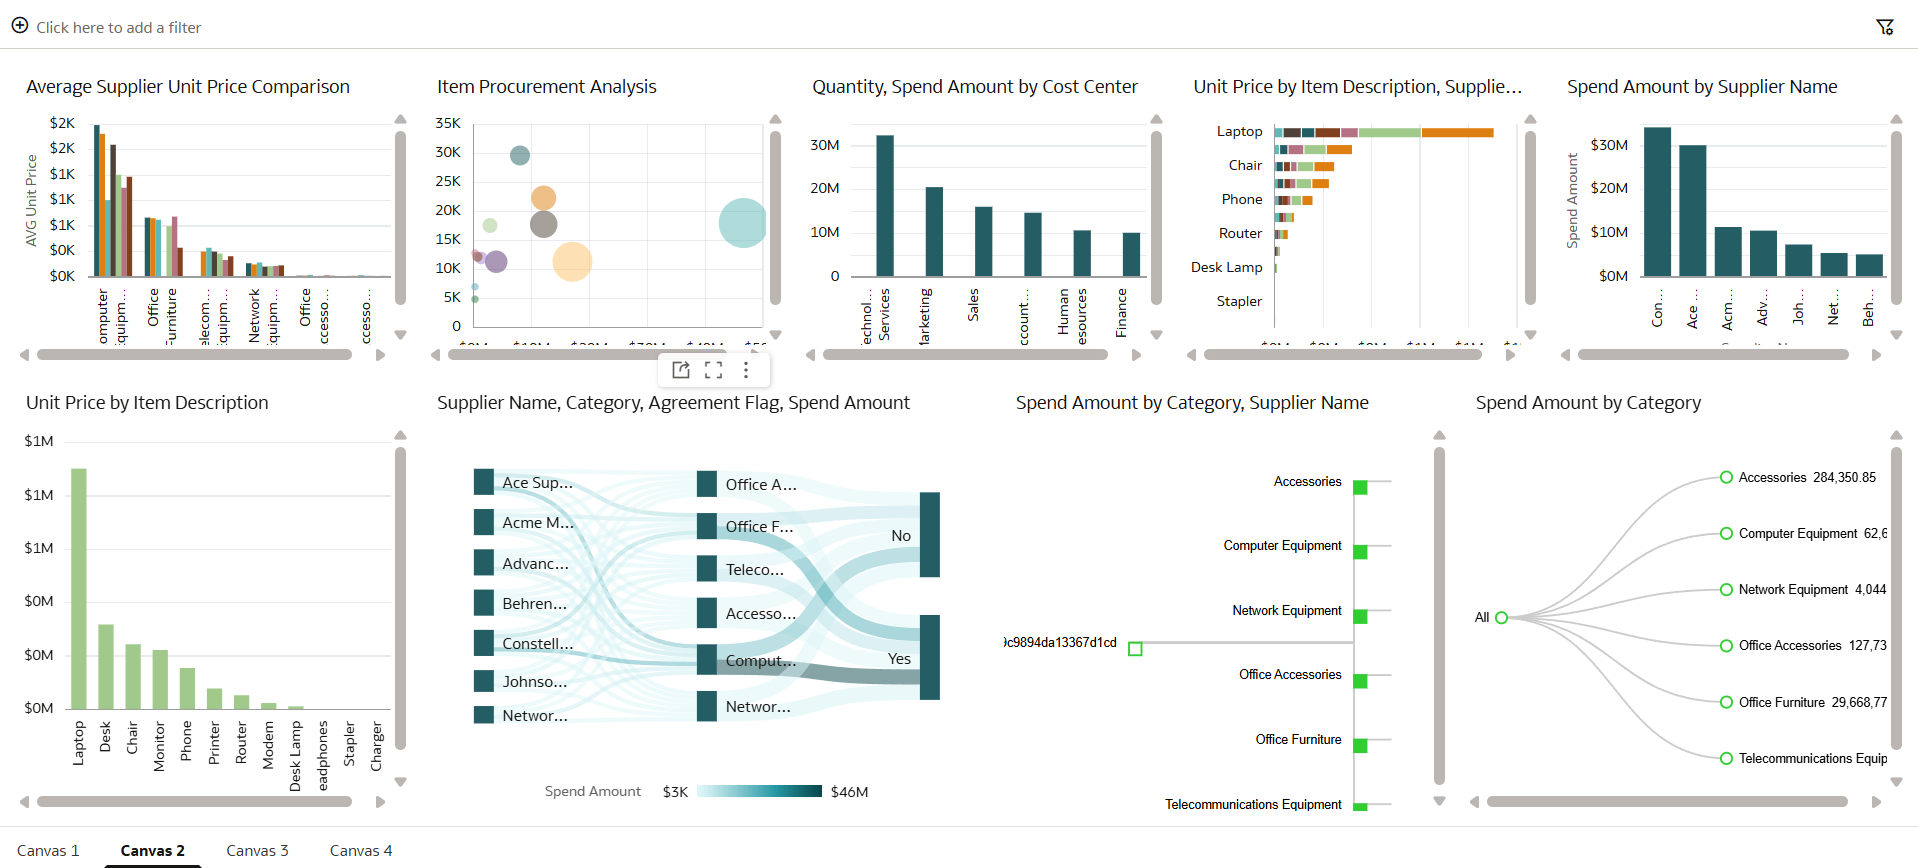
What percentage of procurement is agreement-based vs non-agreement?
Which items have the highest price variation across suppliers?
Where are opportunities for cost optimization?
The dashboard enables data-driven procurement decisions and helps organizations identify cost-saving opportunities, supplier dependencies, and purchasing trends.
5. Did you use any Oracle Analytics AI features when building your visualization? If so, please describe how they were used.
Yes, I used Oracle Analytics AI features such as:
Explain to identify key drivers behind procurement spending trends
Auto Insights to detect patterns in supplier spending and category distribution
AI-assisted visual recommendations to select optimal chart types for procurement analysis
These AI features helped uncover hidden spending patterns, supplier concentration risks, and category-level cost drivers.
6. Did you upload your visualization image and DVA file?
Yes, the dashboard visualization images were uploaded along with the submission.


