1. Which dataset did you use?
HCM Attrition dataset, enhanced to reflect a realistic workforce environment. The original dataset contained several atypical distributions that would not exist in a real organisation that have been corrected so that the data tells a coherent and credible story: one where pay reflects performance, promotion stagnation compounds over time, and training investment has a measurable impact on retention.
2. How did you analyze or prepared the data?
Analysis began inside Oracle Analytics using Insights and Explain on the key attrition fields, which surfaced the most statistically significant drivers and flagged where distributions looked structurally off. Those findings were then taken into an external AI to identify the KPIs and narrative threads most likely to resonate with a Chief People Officer — not just what was significant, but what was actionable and story-worthy. This two-stage approach — OAC for data-grounded discovery, AI for narrative shaping — produced a tighter set of questions that the dashboard is explicitly built to answer.
3. Who is the intended audience?
The primary audience is the Chief People Officer or HR Director — a senior leader who needs to make decisions, not explore data. The design reflects that. Rather than presenting an analytical grid of charts, the report is built as a living one-pager: a single, scrollable document with an editorial voice that guides the reader from what is happening, to why it is happening, to who is at risk, to what to do about it. Typography, hierarchy, and narrative text are used deliberately — every section opens with a question the CPO would actually ask, and every chart is accompanied by interpretive prose that tells the reader what to see and why it matters. The goal was to make the data feel like it is talking to you, not waiting for you to interrogate it.
4. What is your visualisation about and what problem does it address?
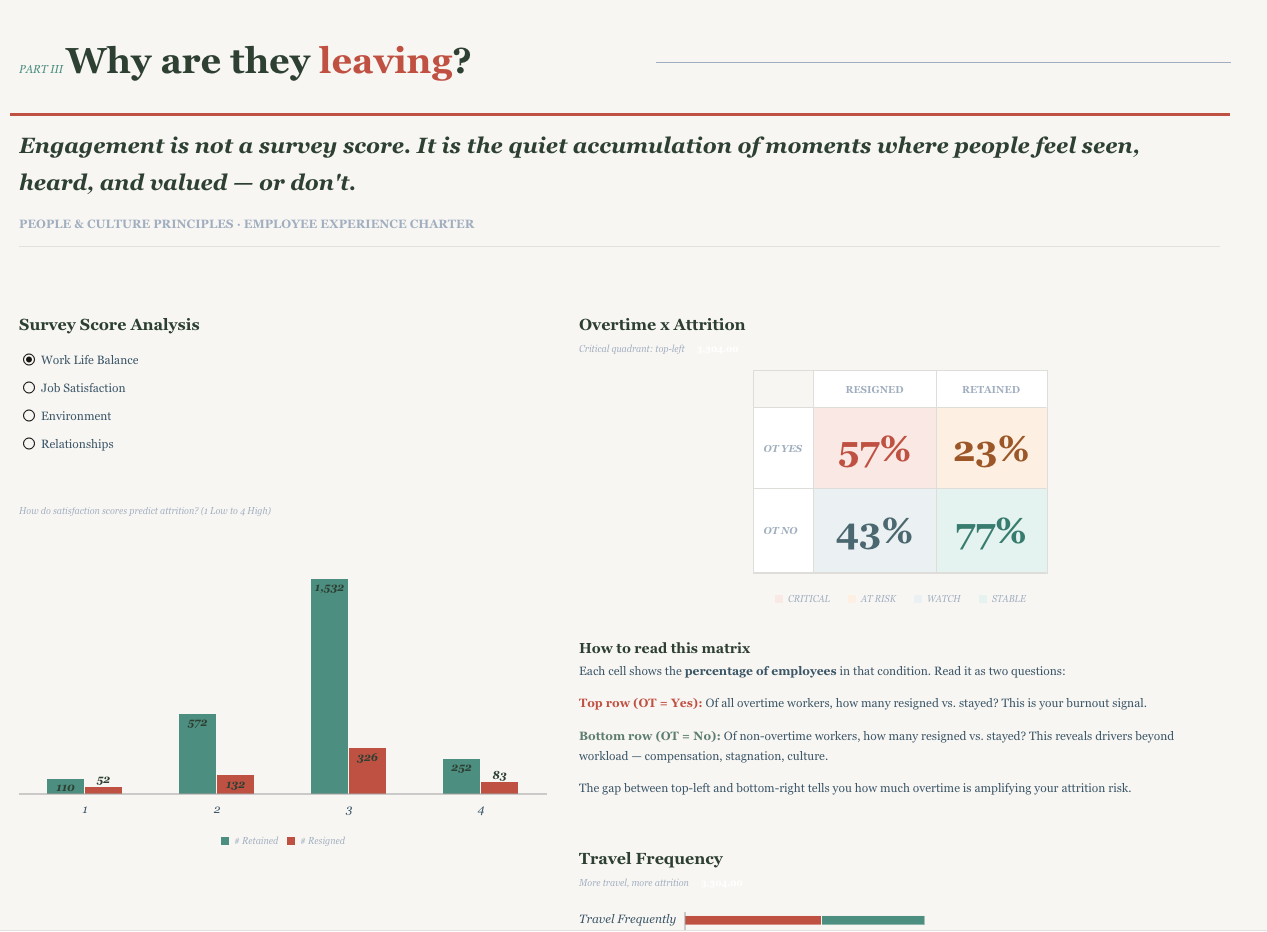
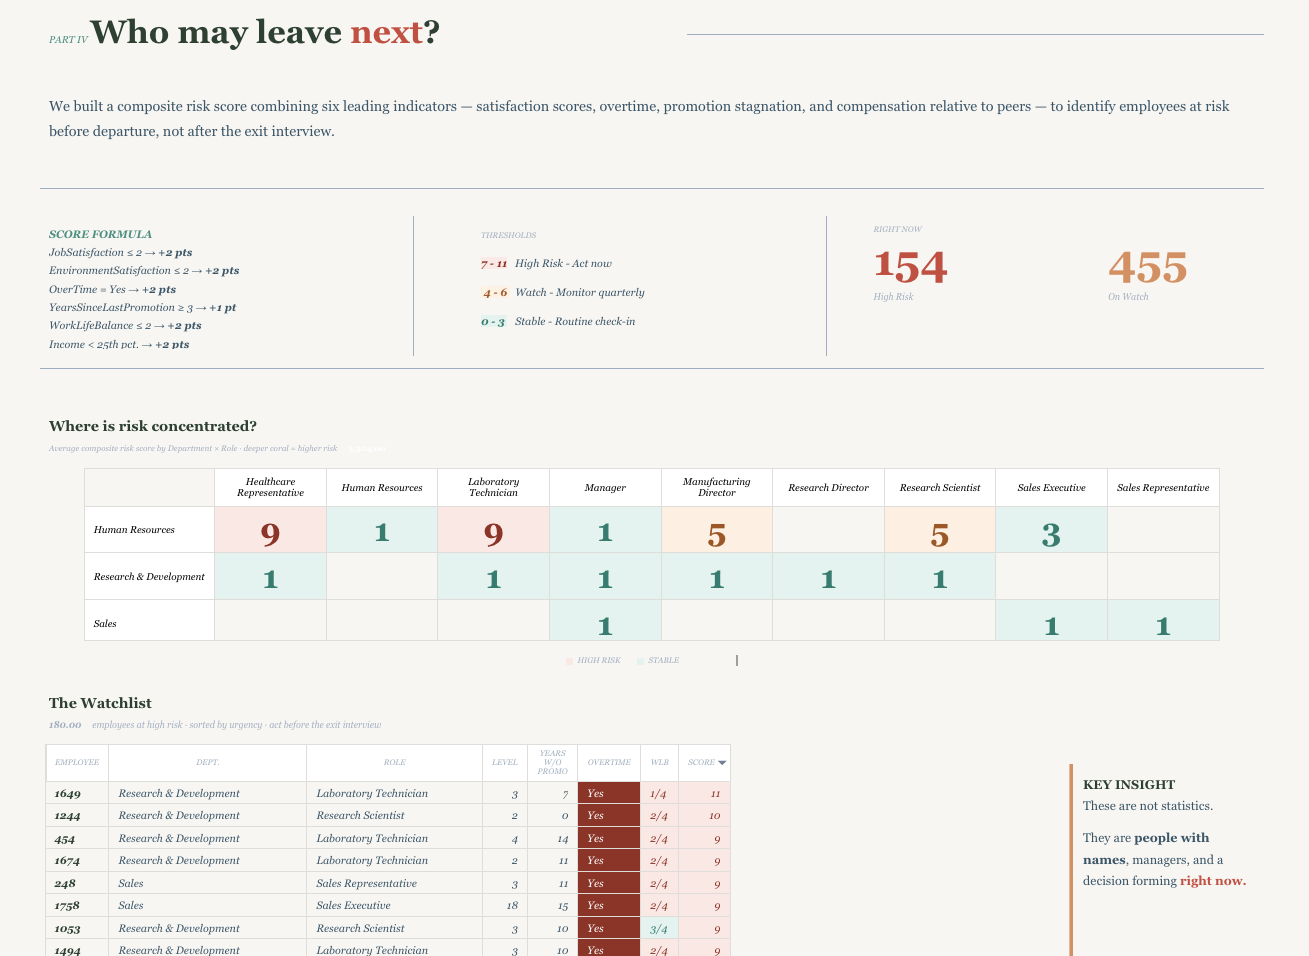
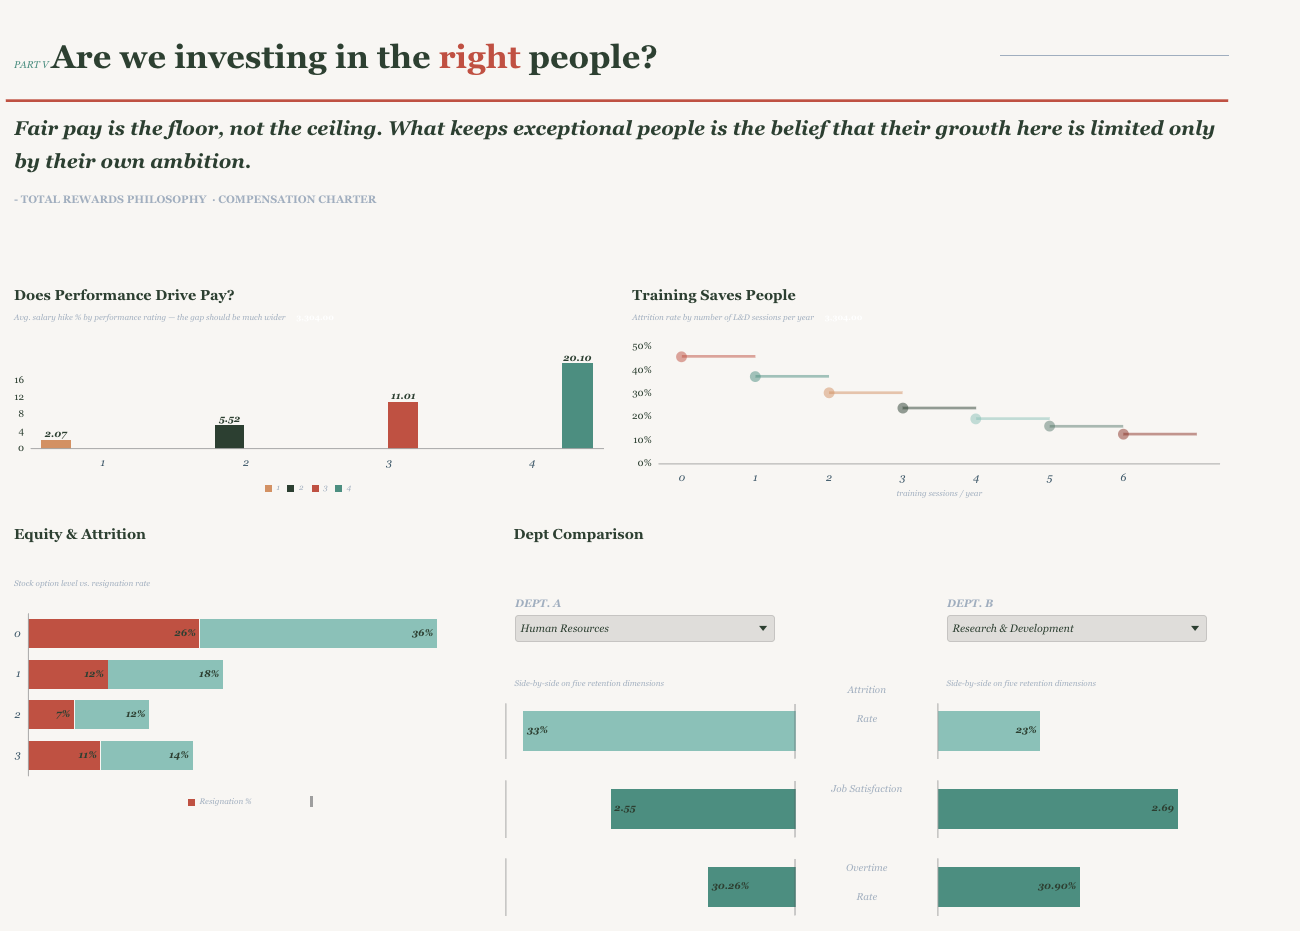
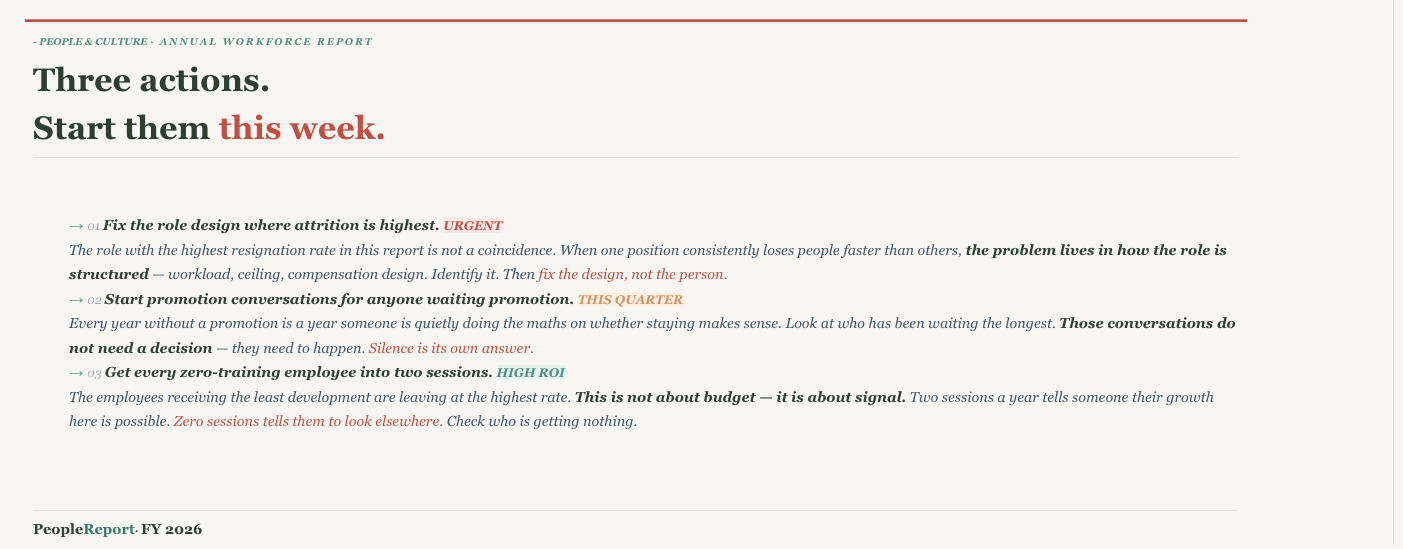
The report addresses a question that most HR dashboards answer too late: not how many people left, but who is about to leave and why. It covers four interconnected dimensions — workforce composition and attrition rates by role and department; the behavioural and structural drivers behind voluntary departures including overtime burden, promotion stagnation, and satisfaction scores; a composite risk model that identifies employees at high risk of leaving before they hand in their notice; and the investment story around pay, training, and growth. Together these move the conversation from reporting on attrition to anticipating and preventing it — giving HR leadership the specific, prioritised information they need to intervene before the exit interview.
5. Did you use any Oracle Analytics AI features?
Yes — a custom AI Agent was built and connected directly to the dataset, allowing users to ask natural language questions about attrition, departures, satisfaction, and training in conversational terms. The agent includes tailored supplemental instructions that map business questions to the correct columns, enforce plain-language labels, and redirect risk-related queries to the dashboard visuals where the composite scoring lives. Auto-generated Narratives were evaluated but not used in the final report: the out-of-the-box prose was too technical and statistical in tone, describing what the numbers were rather than what they meant. Rather than surface language that felt misaligned with the report's editorial voice, the decision was made to replace Narratives with carefully crafted interpretive text — written to guide the reader toward a conclusion and a next action, which is what a CPO audience actually needs from a report like this.