Categories
- All Categories
- Oracle Analytics and AI Learning Hub
- 54 Oracle Analytics and AI Sharing Center
- 25 Oracle Analytics and AI Lounge
- 307 Oracle Analytics and AI News
- 57 Oracle Analytics and AI Videos
- 16.4K Oracle Analytics and AI Forums
- 6.6K Oracle Analytics and AI Labs
- Oracle Analytics and AI User Groups
- 118 Oracle Analytics and AI Trainings
- 22 Oracle Analytics and AI Challenge
- Find Partners
- For Partners
Salary gender pay gap
I have this example:
1st column: salary
2nd: gender
3rd and on: other variables
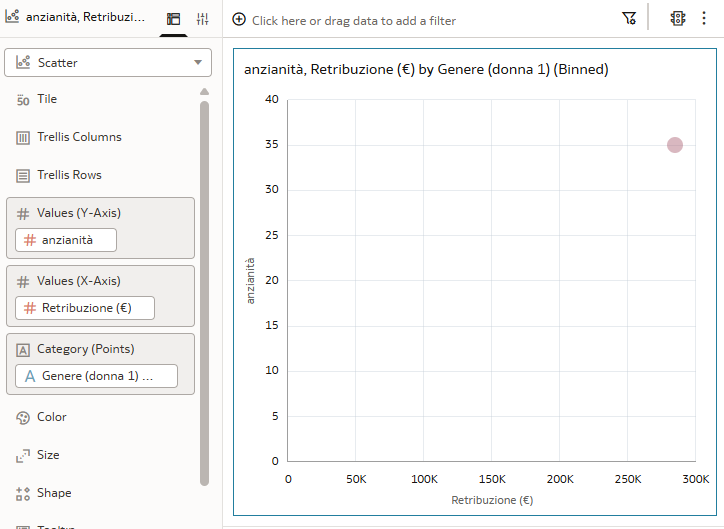
I'm trying to plot a scatter chart, so far I have this:
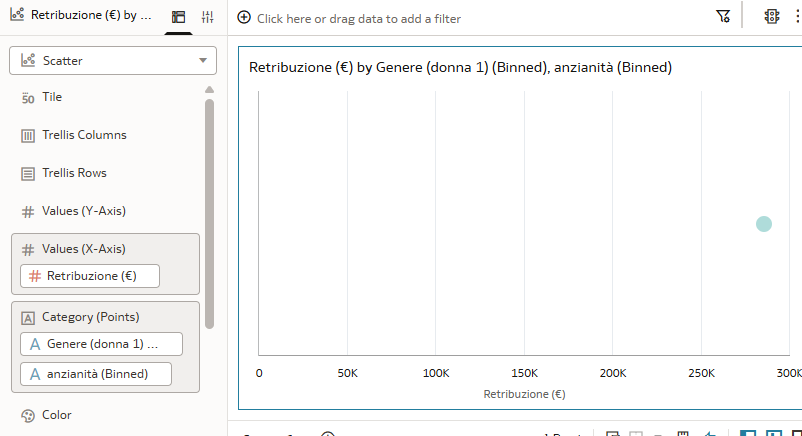
I'm trying to obtain something like this, with line showing all coefficients:
What I'm doing wrong? I tried different configurations
Answers
-
Your scatter plot only has the X-axis configured (Retribuzione/Salary) but is missing a Y-axis measure. A scatter plot needs two numeric measures to plot points meaningfully.To get the regression line like in your example image, after the chart renders properly you need to: right-click on the visualization → Add Statistics → Trend Line, then choose Linear.
0 -
Hi @Vasudha_Oracle-Oracle , this is the result:
0 -
It seems like you have a SUM aggregation on Age. Check if these videos help you.
How to Use Plots to Show the Distribution of Data in Oracle FDI
How to Identify and Highlight Outliers in Oracle Fusion AI Data Platform0 -
Problem is that my raw data are written up above in the question.. there are no sums :(
0 -
Metrics will get aggregated automatically. Find a good attribute, score will work better than Genre (as it has only 2 possible values).
0


