1. Which dataset did you use?
I used the IPL dataset (2008–2025) from Kaggle. It has ball-by-ball data, player stats, and match results.
2. How did you analyze or prepare the data?
I explored the data using Explain and Auto Insights. I created a few calculated fields for boundaries and player performance, and then organized it season-wise and player-wise.
3. Who is the intended audience for your visualization?
Cricket analysts, team strategy teams, and IPL fans.
4. What is your visualization about, and what question or problem does it address?
The dashboard shows how IPL has changed from 2008 to 2025. It focuses on scoring patterns, player performance, and how the game has become more aggressive over time. It helps understand who the top performers are and how T20 cricket has evolved.
5. Did you use any Oracle Analytics AI features when building your visualization (ex. AI Assistant)? If so, please describe how they were used
Yes. I used Explain and Auto Insights to look at the data and understand the trends. It helped me decide what to include in the dashboard.
6. Did you upload your visualization image and dva file?
Yes, I have uploaded both the visualization image and the DVA file.
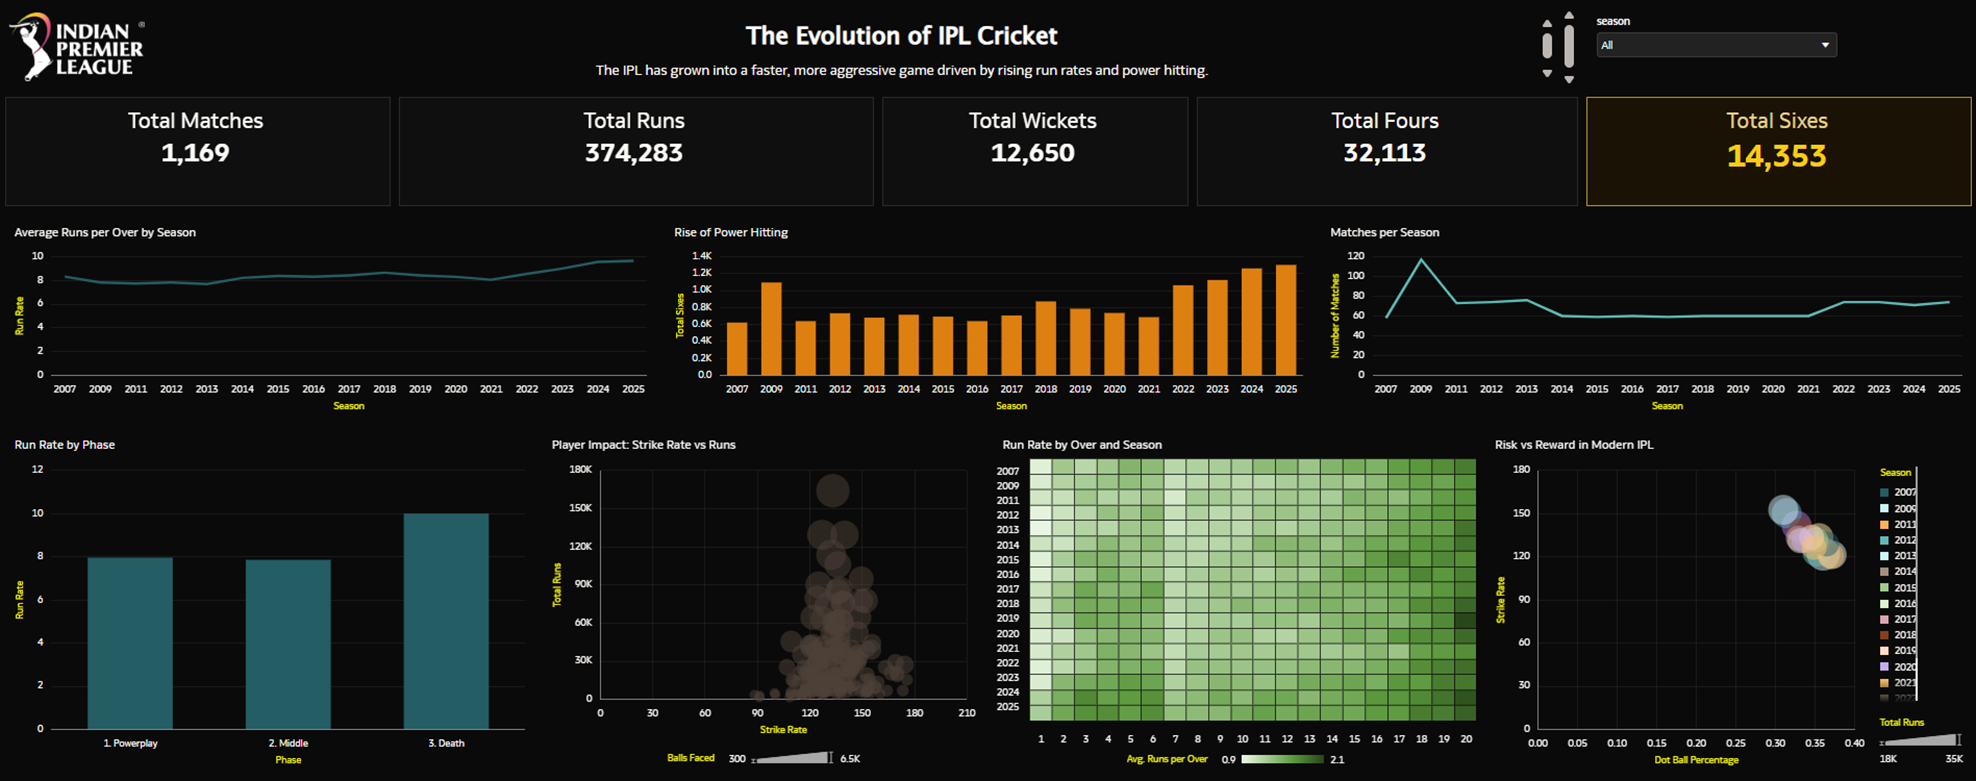
🏆 The Evolution of IPL Cricket
Overview
The IPL has evolved from a balanced format into a faster and more aggressive game. This dashboard analyzes how scoring patterns, player behavior, and match strategies have changed from 2008 to 2025.
Key Insight
The IPL today is driven by rising run rates and power hitting, with teams pushing for higher scores.
What This Dashboard Shows
- Run rates have steadily increased across seasons
- Power hitting has become a key factor in scoring
- Death overs now contribute significantly to total runs
- Players balance high strike rates with consistent scoring
- Teams take more risks to maintain scoring momentum
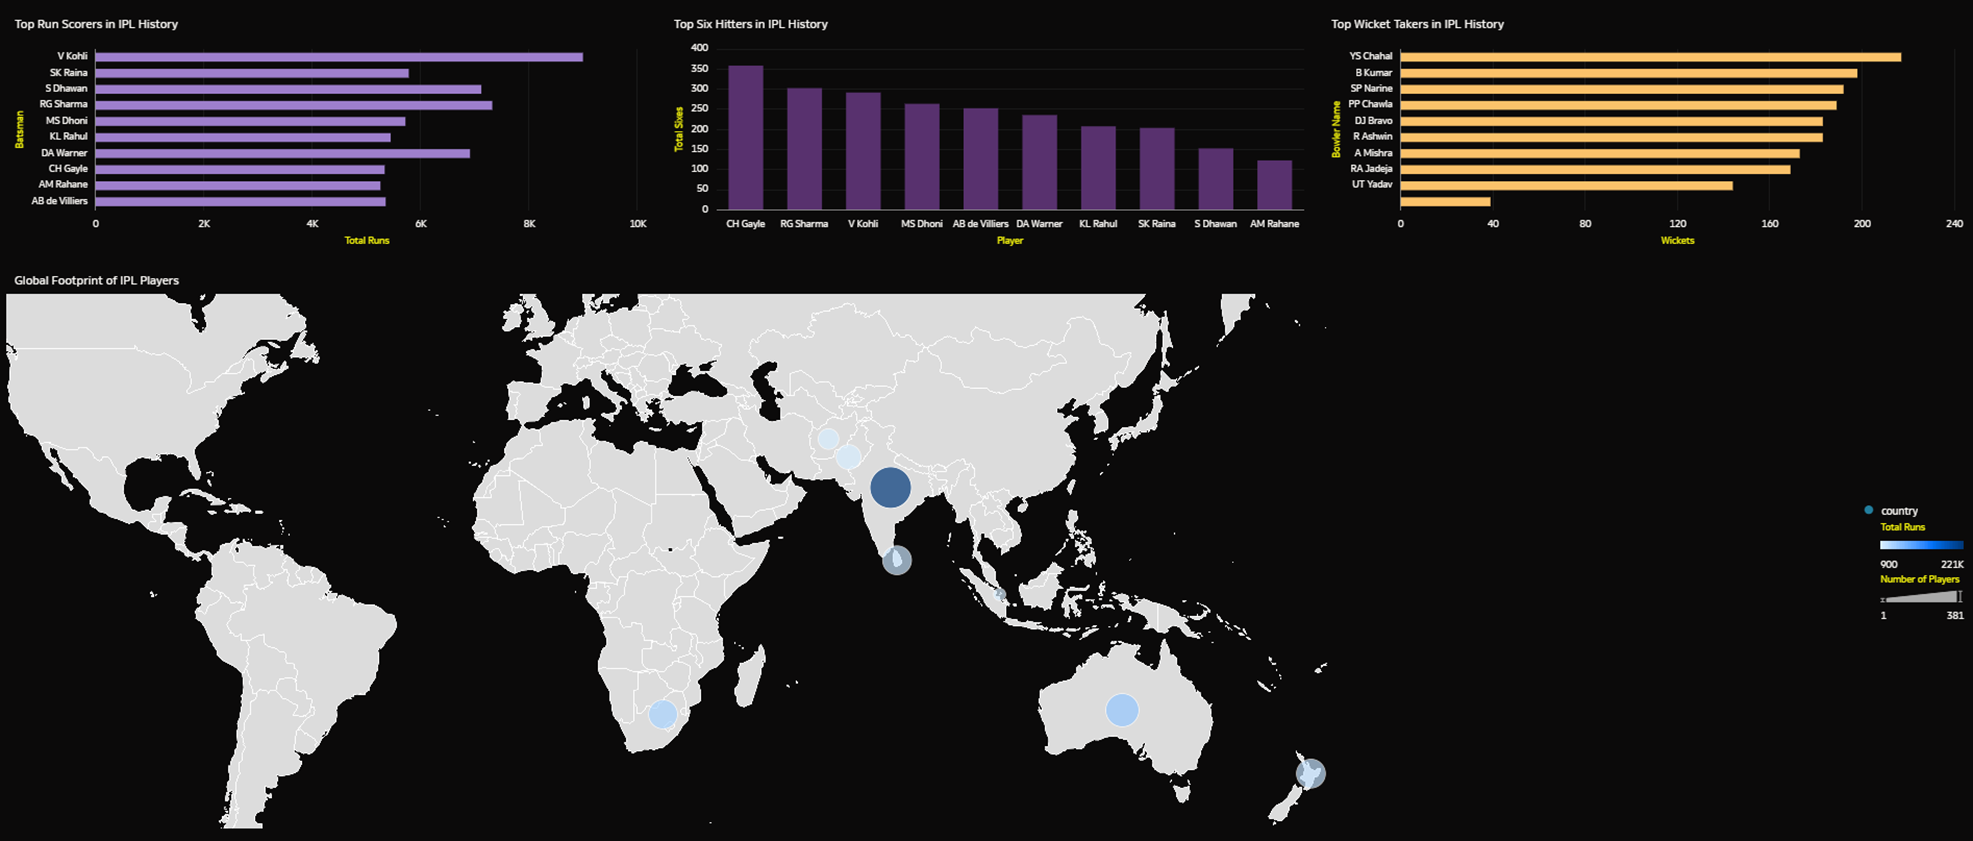
Top Performers and Match Insights
- Top Run Scorers: Highlights the most consistent performers across seasons
- Top Wicket Takers: Shows bowlers who have had the greatest impact
- Top Six Hitters: Highlights the rise of power hitting in modern IPL
Global View
The IPL continues to attract players from across the world, with strong contributions from major cricketing nations.
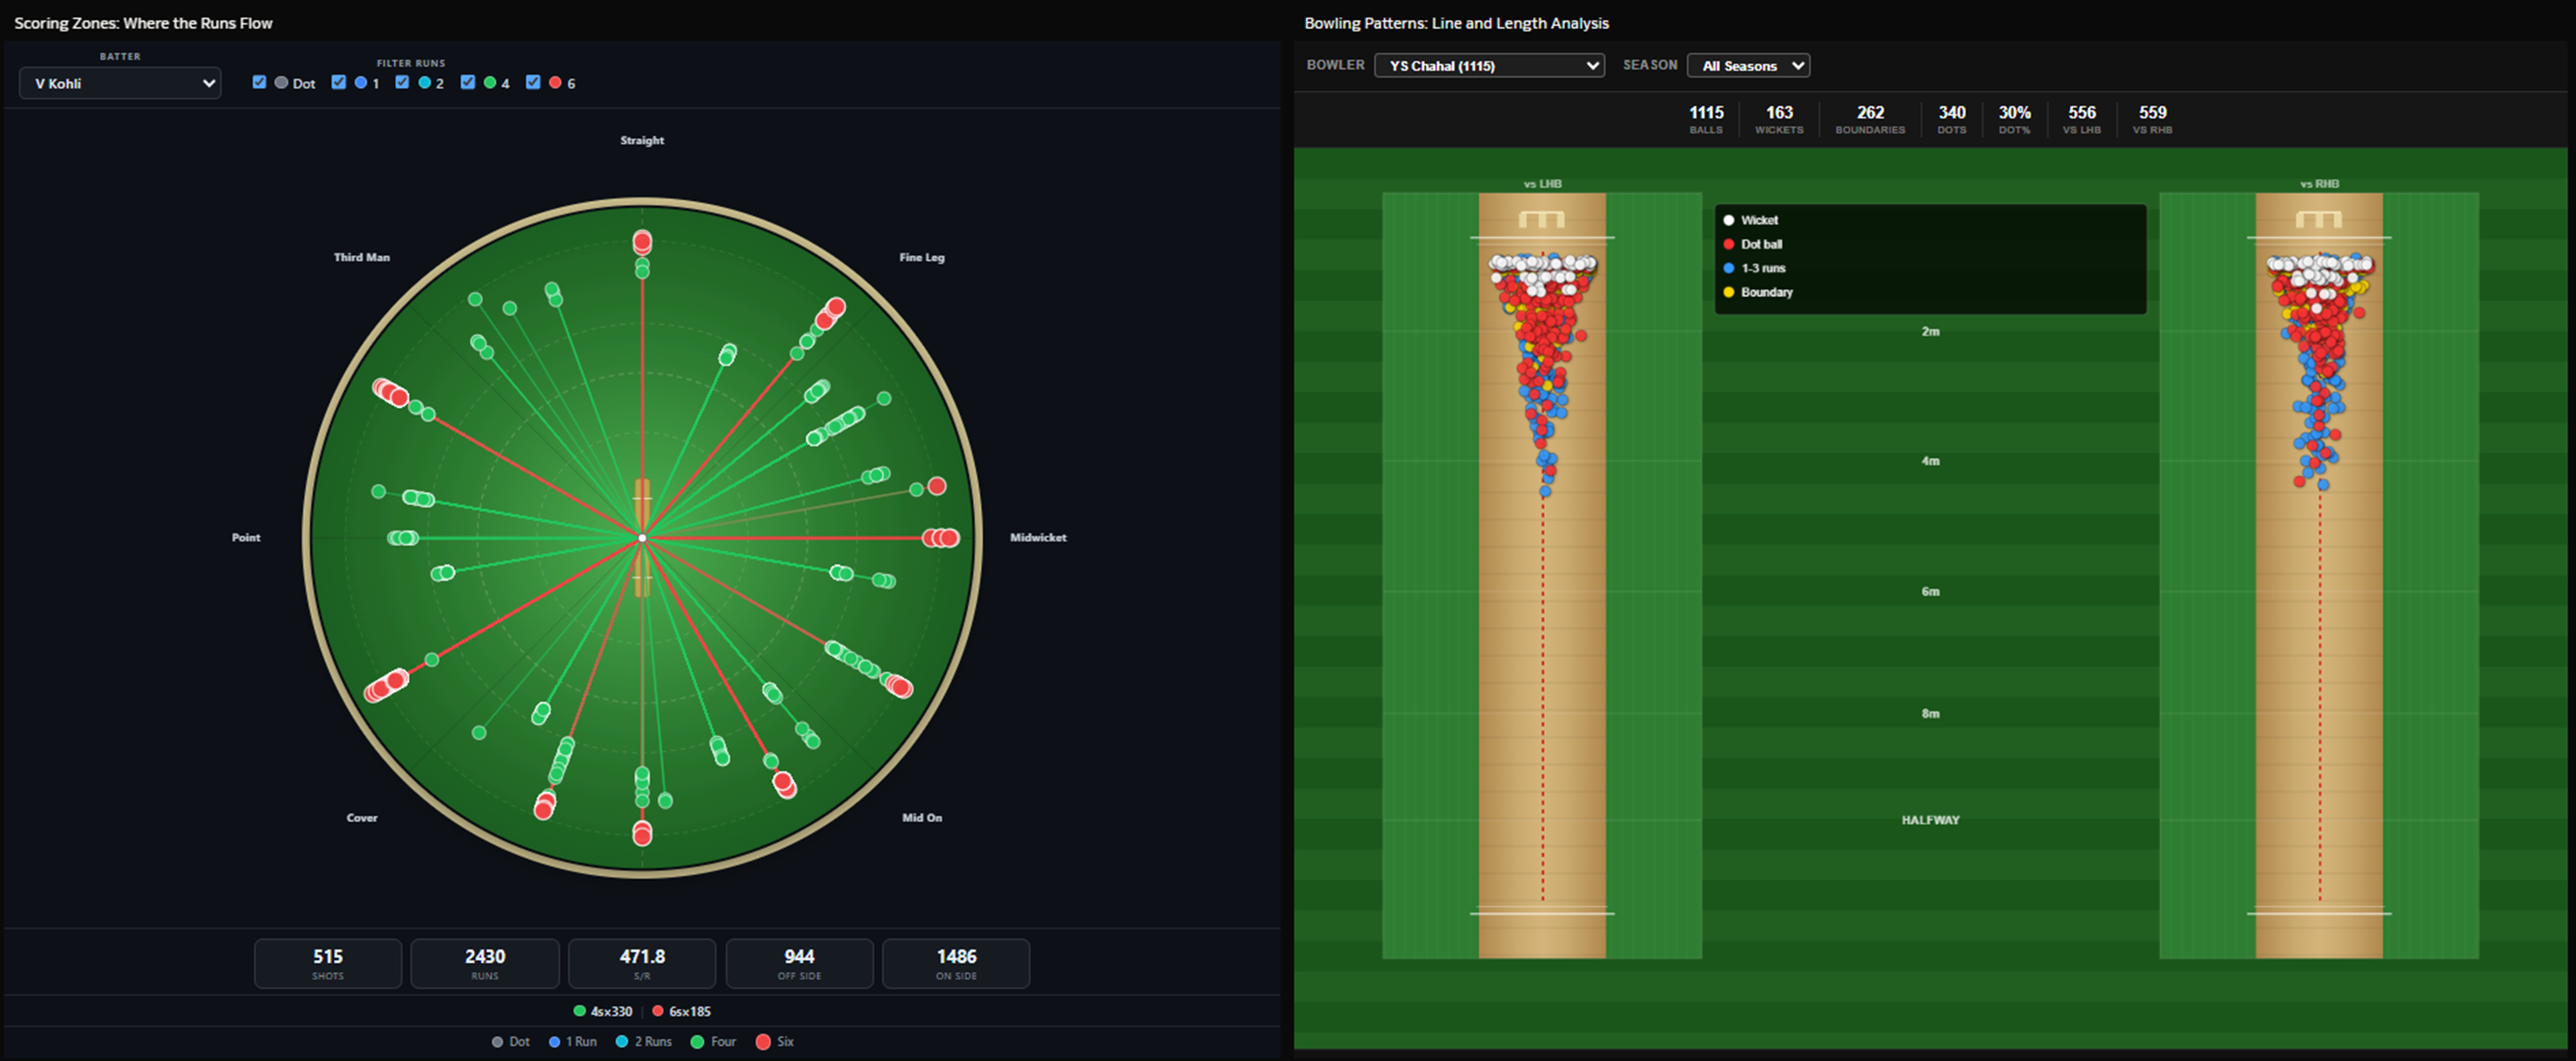
Advanced Analysis
- Scoring Zones (Wagon Wheel): Shows where batters score their runs across the field
- Bowling Patterns (Pitch Map): Highlights line and length consistency of bowlers
These visuals were created using custom extensions to replicate real match analysis and provide deeper insights beyond standard charts.
Design Approach
The dashboard uses a clean dark theme with minimal colors to highlight key insights. The layout is structured to guide the viewer from overall trends to detailed analysis.
Conclusion
The IPL has transformed into a high-intensity format where scoring quickly is essential, and teams have adapted their strategies accordingly.


