- Which dataset did you use?
Data taken from Kaggle/Wikipedia - How did you analyze or prepare the data?
I combined streaming and song feature data from Spotify with social media metrics. - Who is the intended audience for your visualization?
The dashboard is designed for music fans, data visualization enthusiasts interested in artist performance insights.
It also targets fans of Bad Bunny and those who were not familiar with his music (like me) who want to explore how his streaming success and social media growth compare with other global artists. - What is your visualization about, and what question or problem does it address?
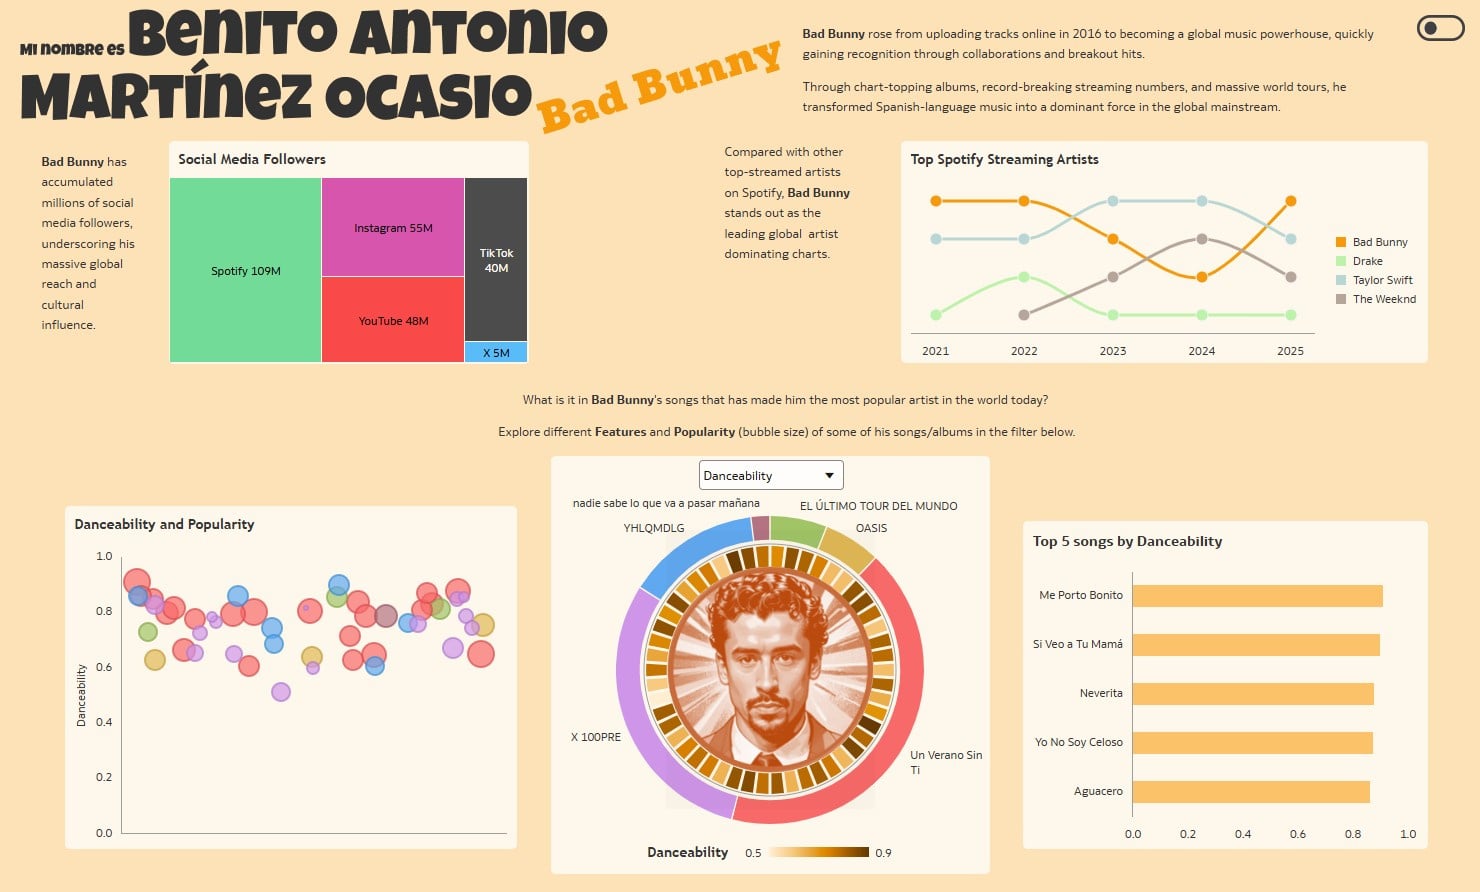
The visualization explores the global impact of Bad Bunny, combining streaming performance, song characteristics, and social media impact.
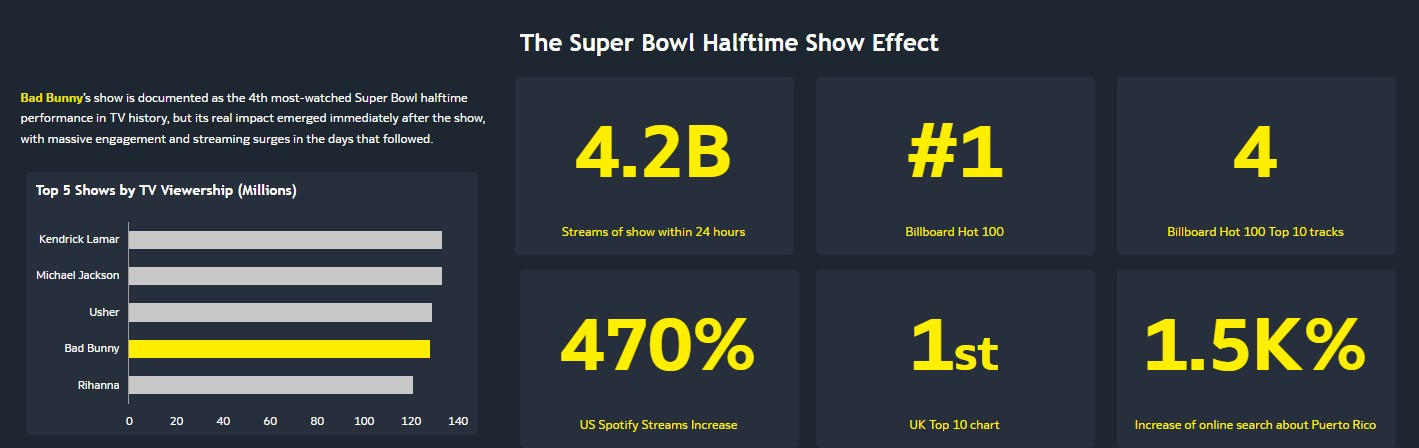
It examines how a major cultural event like the Super Bowl Halftime Show influences streaming numbers, engagement, and overall popularity. - Did you use any Oracle Analytics AI features when building your visualization (ex. AI Assistant)? If so, please describe how they were used.
I used oracle.chat.com to generate some of the narrative. I also used an AI Image generator to replicate the face of the artist. - Did you upload your visualization image and dva file?
Yes, .dva file is attached below
Enjoy these sections:
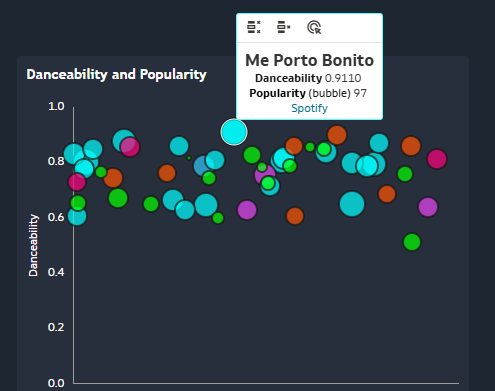
Understand the features behind his songs
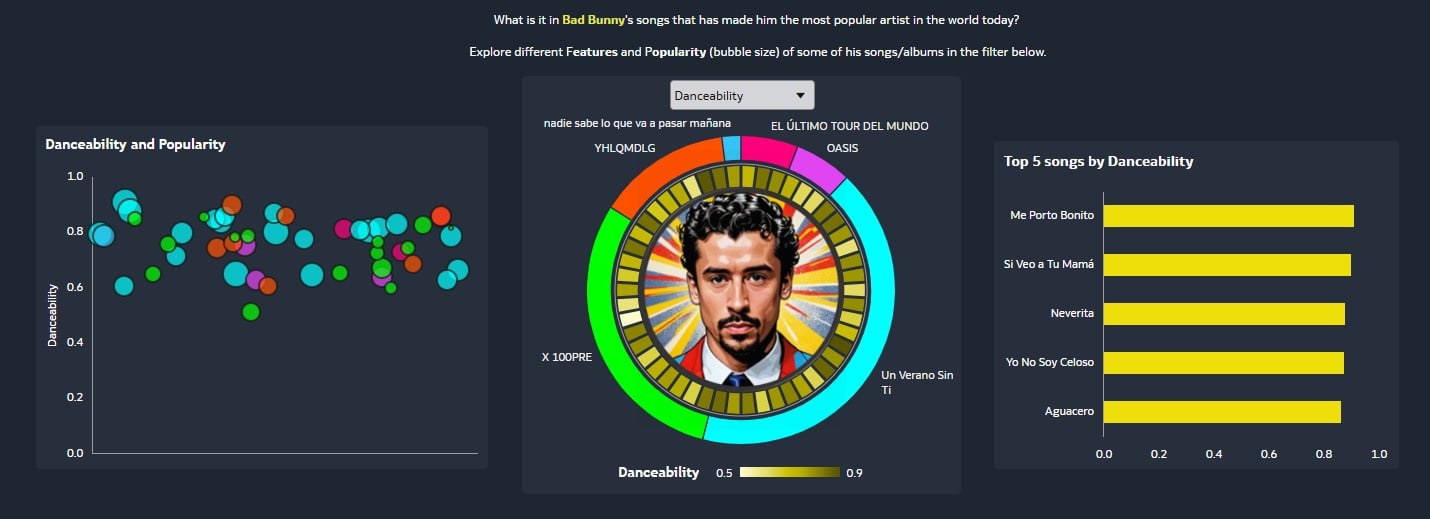
Play a preview of the song
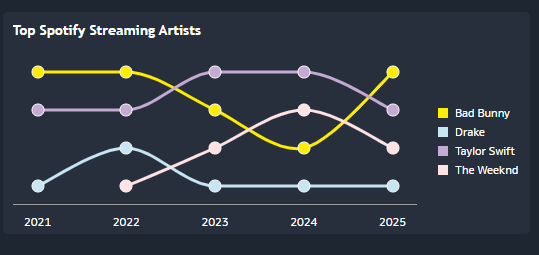
Streaming comparison to other artists
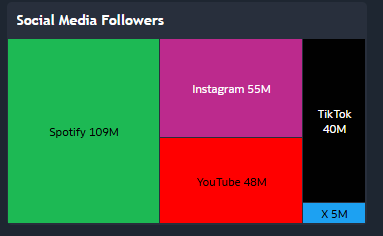
Compare SM Followers base
Super Bowl Halftime Show effect
Dark/light mode toggle
Preview