Human Capital Management Dashboard
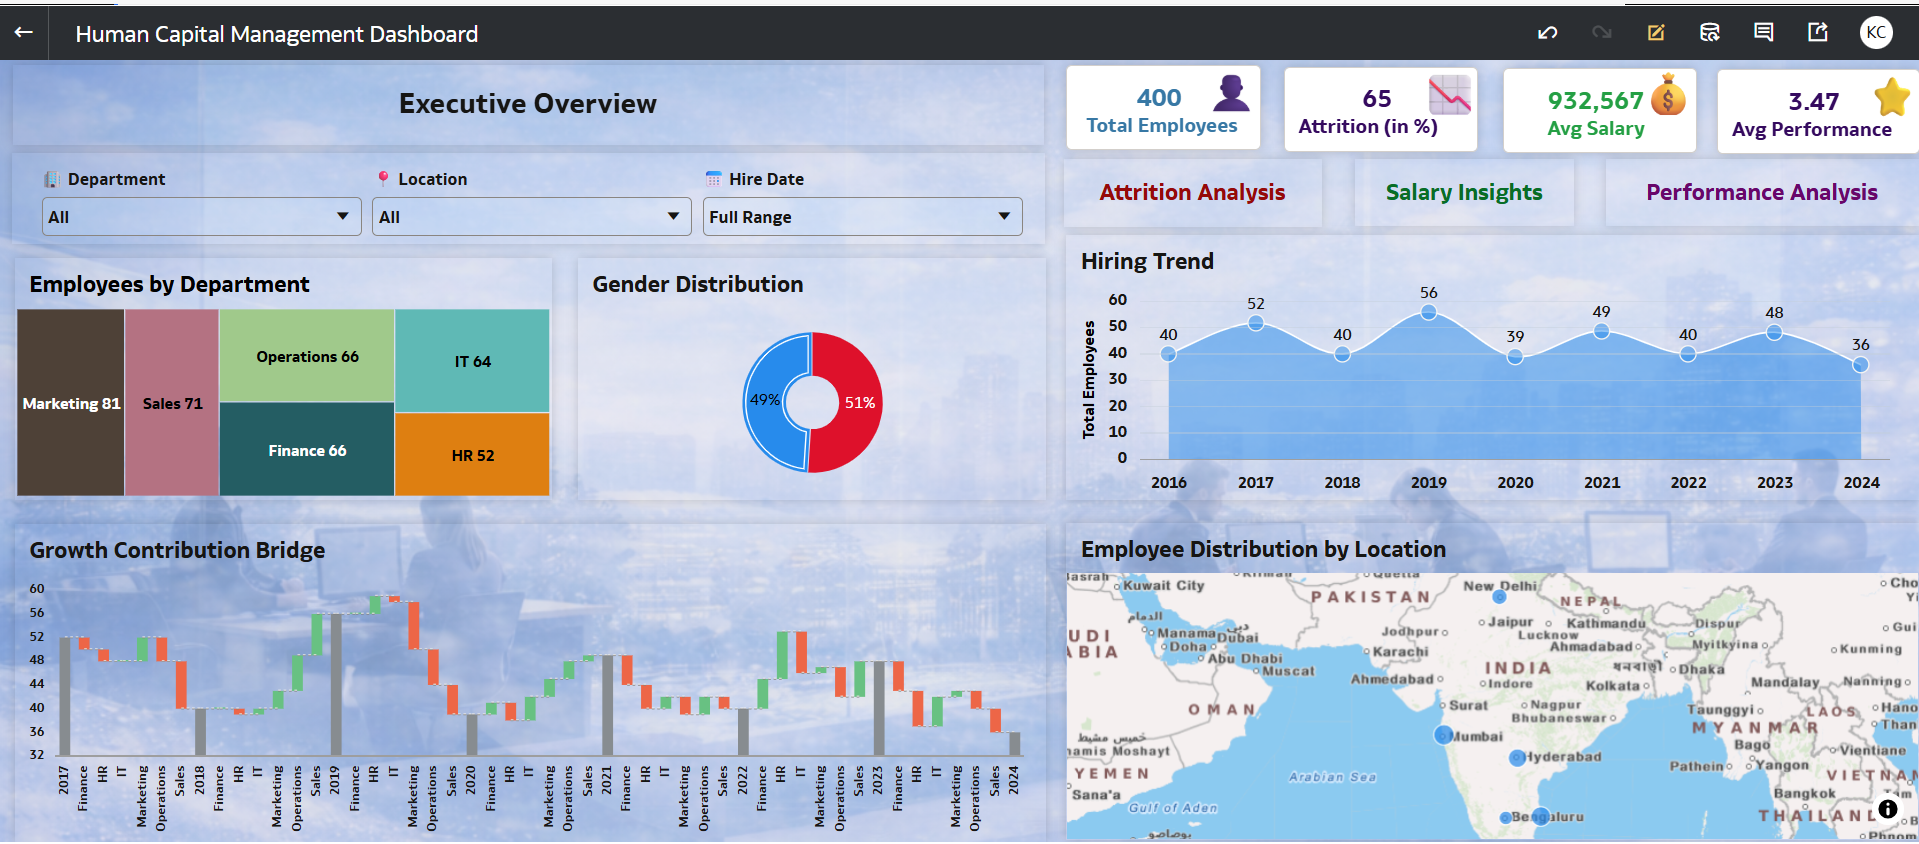
This dashboard provides an integrated analytical view of workforce performance and HR efficiency by combining employee distribution, salary, attrition, and performance metrics into a single decision-support framework. It connects departmental trends with workforce indicators to ensure optimal resource allocation, talent retention, and strategic HR planning across the organization.
1.Which dataset did you use?
I used a synthetic HCM employee dataset containing Employee Ids, Name, Department, Location, Gender, Age, Experience, Job Role, Salary, Performance Rating, Attrition, and Hire Date, covering multiple departments and locations across India. The data is stored in a single Oracle Analytics Cloud workbook and provides a complete view of the workforce for analytics and dashboard creation.
2. How did you analyze or prepare the data?
I cleaned and standardized numeric fields like Salary, Experience, and Performance Rating, created calculated KPIs such as Average Salary, Attrition %, Performance Index, and Employee Tenure, categorized Salary bands, experience levels, and Age groups for better insights, that can be use as applied filters and dynamic drilldowns in OAC to enable interactive workforce analysis.
3.Who is the intended audience for your visualization?
The dashboard is designed for HR managers, department heads, executives, and analysts to monitor workforce trends, attrition, salary distribution, and employee performance, helping decision-makers make informed strategic HR and workforce planning decisions.
4.What is your visualization about, and what question or problem does it address?
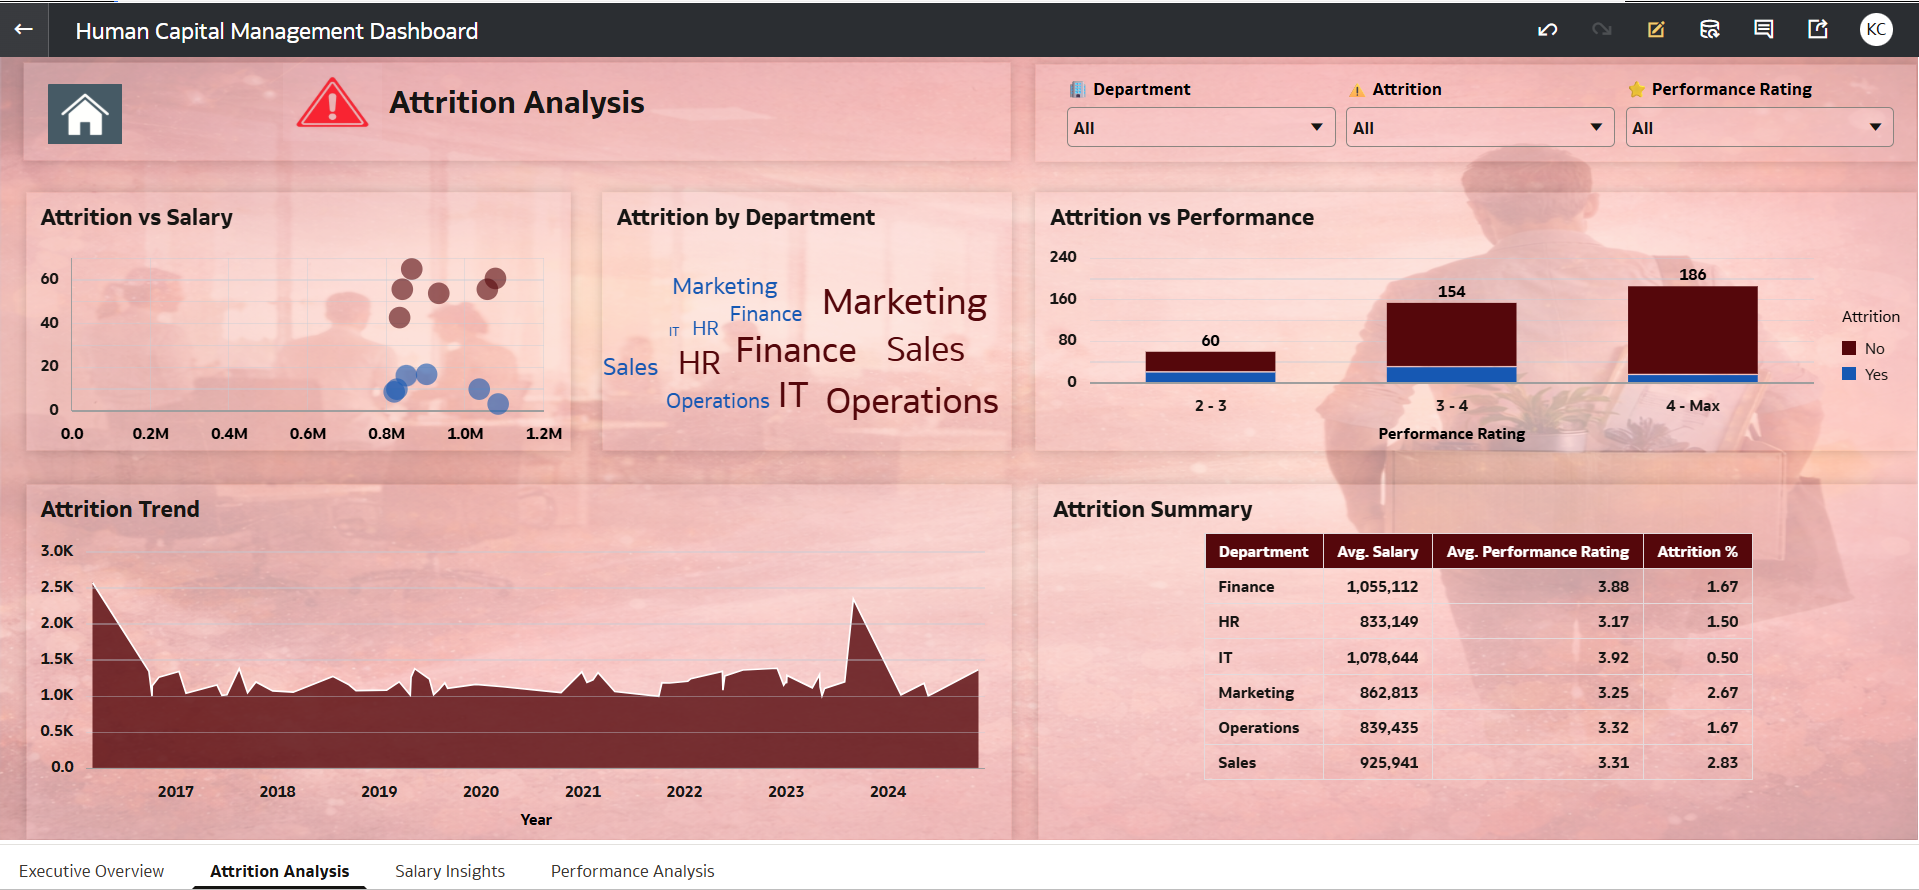
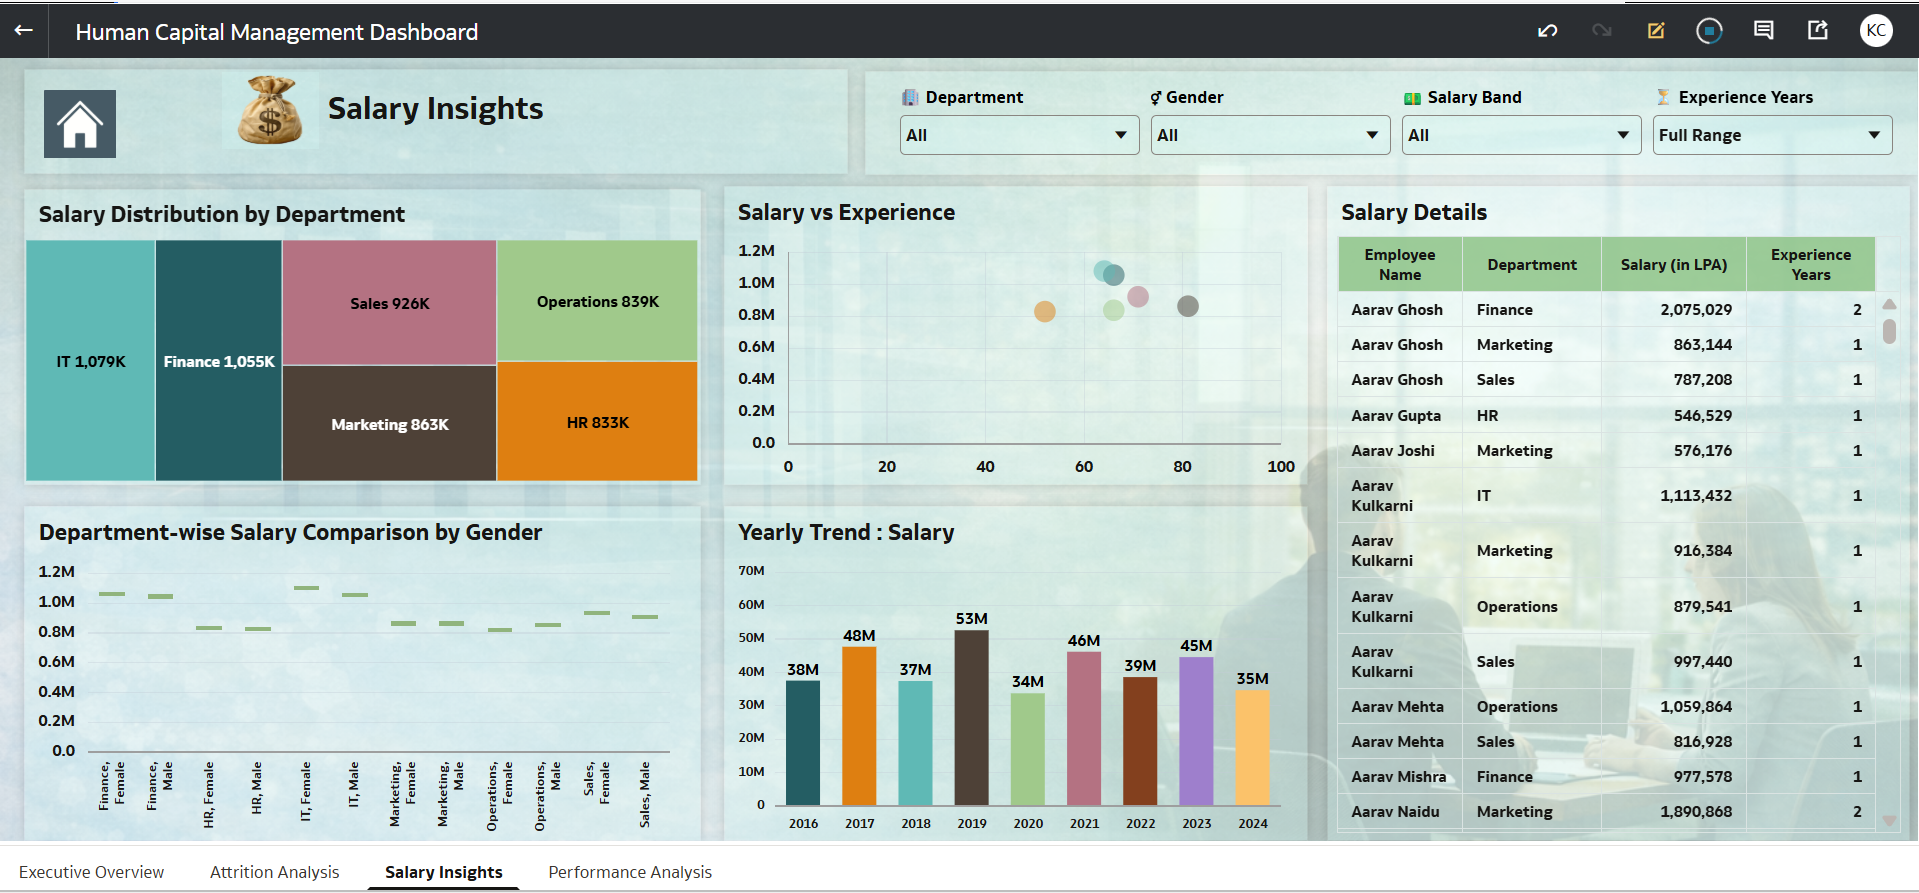
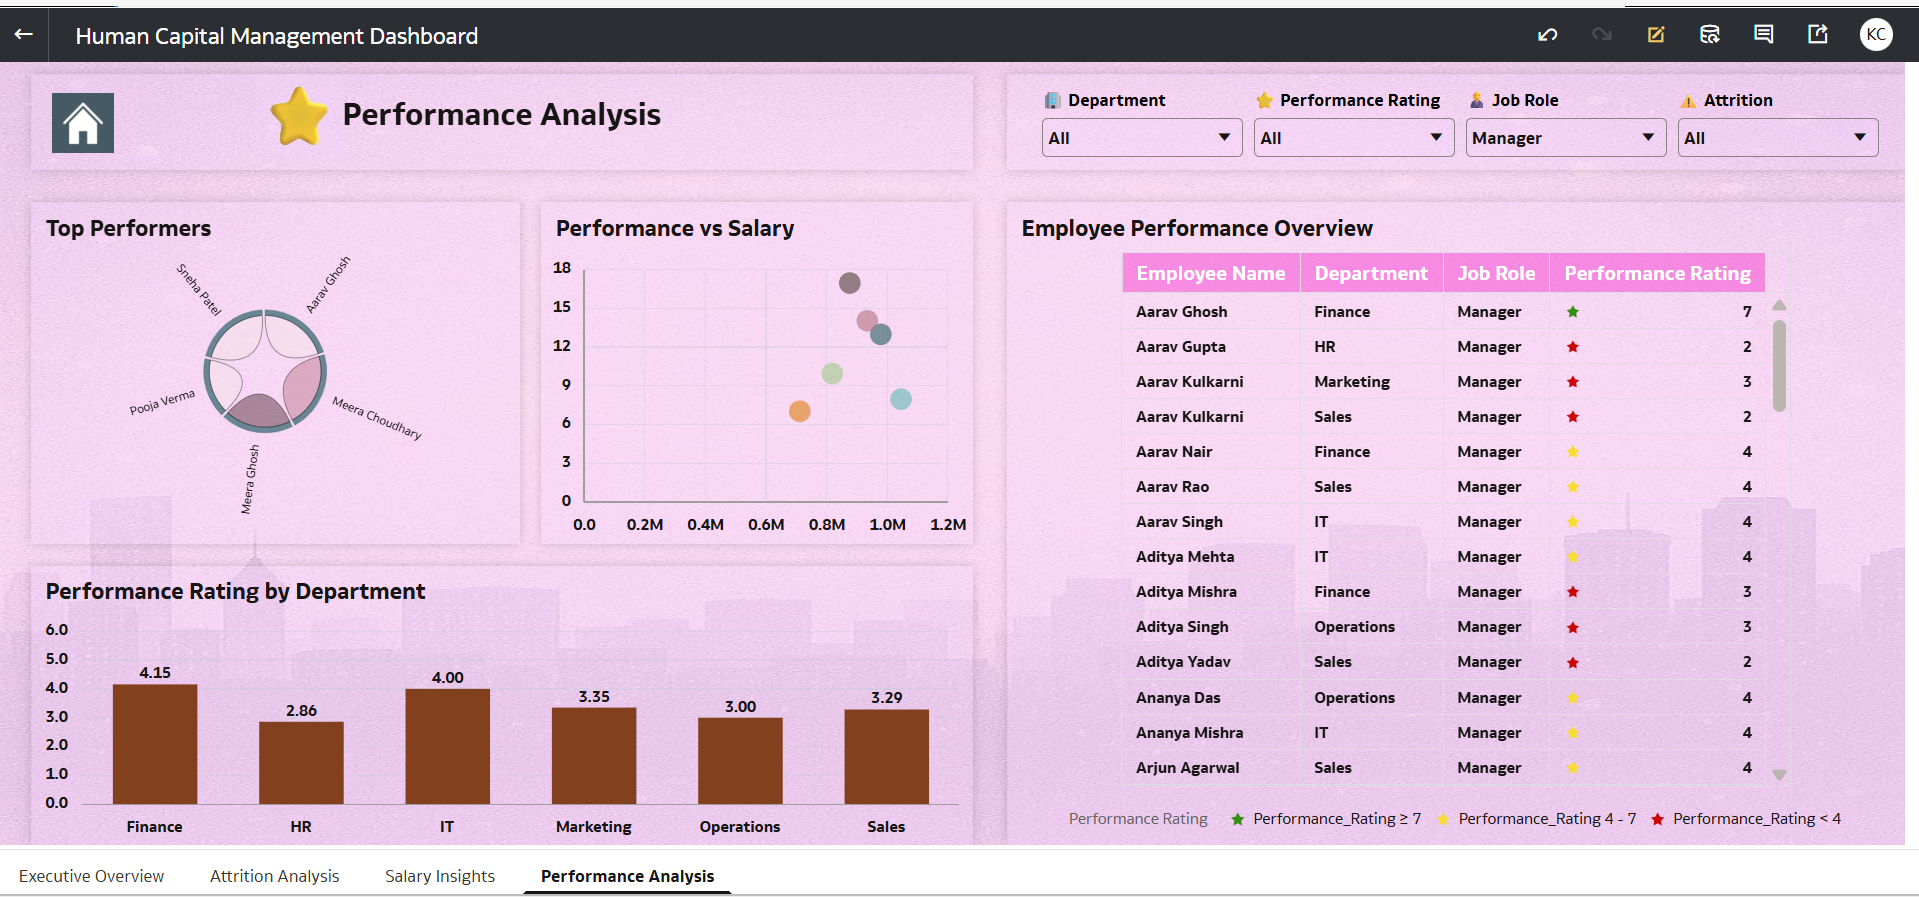
The visualization shows workforce distribution, performance, salary, attrition, and tenure trends, addressing questions such as which departments have higher attrition, salary gaps, or top performers, while supporting optimization of HR strategy, retention, and workforce planning decisions.
5.Did you use any Oracle Analytics AI features when building your visualization?
Yes, I have utilized Oracle AI capabilities for Growth Contribution Bridge and Yearly Trend: Salary
6.Did you upload your visualization image and DVA file?
Yes, the HCM dashboard image and DVA workbook were successfully uploaded.
