1. Which dataset did you use?
I used a Coffee Sales transactional dataset that includes:
- Order details (Order ID, Date, Time)
- Product information (Coffee Name, Category)
- Sales metrics (Revenue, Quantity, Transaction Value)
- Time attributes (Hour, Day, Month, Quarter)
2. How did you analyze or prepare the data?
Data preparation steps:
- Data Cleaning:
- Removed null and duplicate records
- Standardized coffee names and categories
- Feature Engineering:
- Extracted Year, Quarter, and Month from the Order Date
- Derived Hour and categorized Time of Day (Morning, Afternoon, Night)
- Created calculated measures such as Total Revenue, Average Transaction Value, and Total Orders
- Aggregation:
- Grouped data by coffee type, time of day, and quarter
- Data Modeling (in OAC):
- Created measures and hierarchies
- Enabled filters for dynamic data slicing
3. Who is the intended audience?
The dashboard is designed for:
- Business Executives / Store Managers
- Sales Managers
- Operations Teams
Purpose:
- Support quick decision-making
- Identify sales patterns
- Monitor overall performance
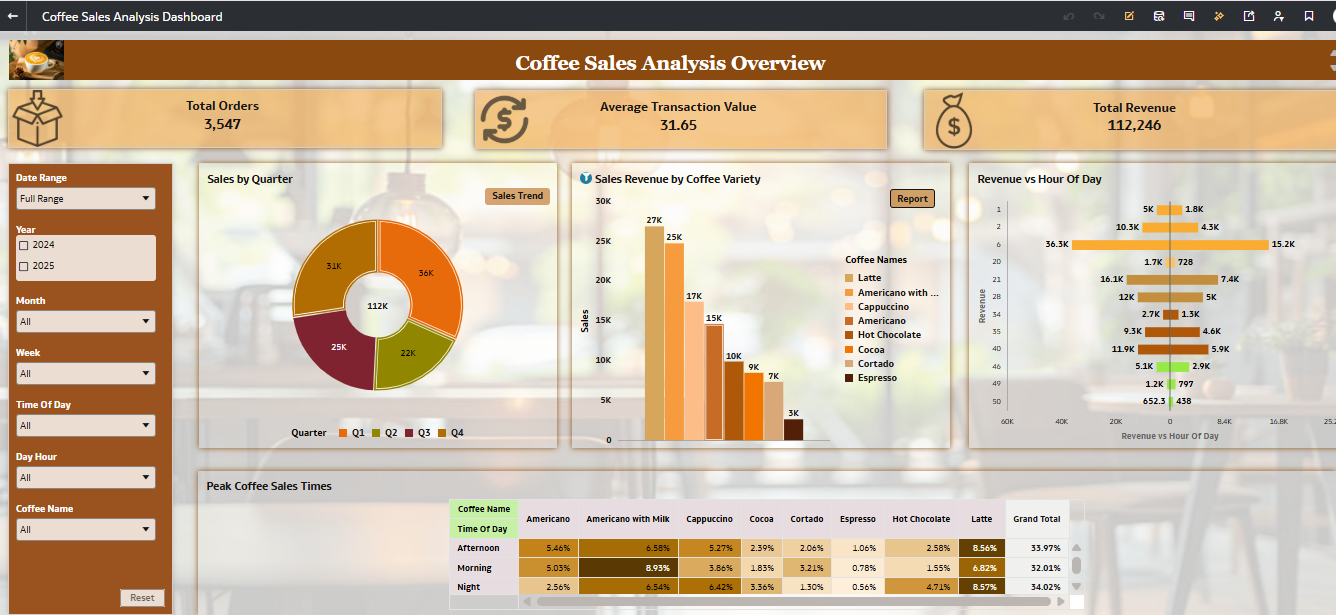
4. What is your visualization about, and what problem does it address?
This is a Coffee Sales Performance Dashboard that answers key business questions:
- Which coffee products generate the most revenue?
- What time of day drives the highest sales?
- Are sales improving across quarters?
- What are the peak sales periods?
Problem it addresses:
- Limited visibility into sales trends and customer behavior
- Helps optimize:
- Product strategy
- Staffing during peak hours
- Sales performance tracking
5. Did you use Oracle Analytics AI features?
Yes, I utilized Oracle Analytics AI features:
- Built visuals like Revenue vs Hour of the Day and Peak Coffee Sales Times using Auto Insights, with further refinements
- Enabled the AI Assistant for the dataset, allowing users to ask natural language questions and receive automated insights
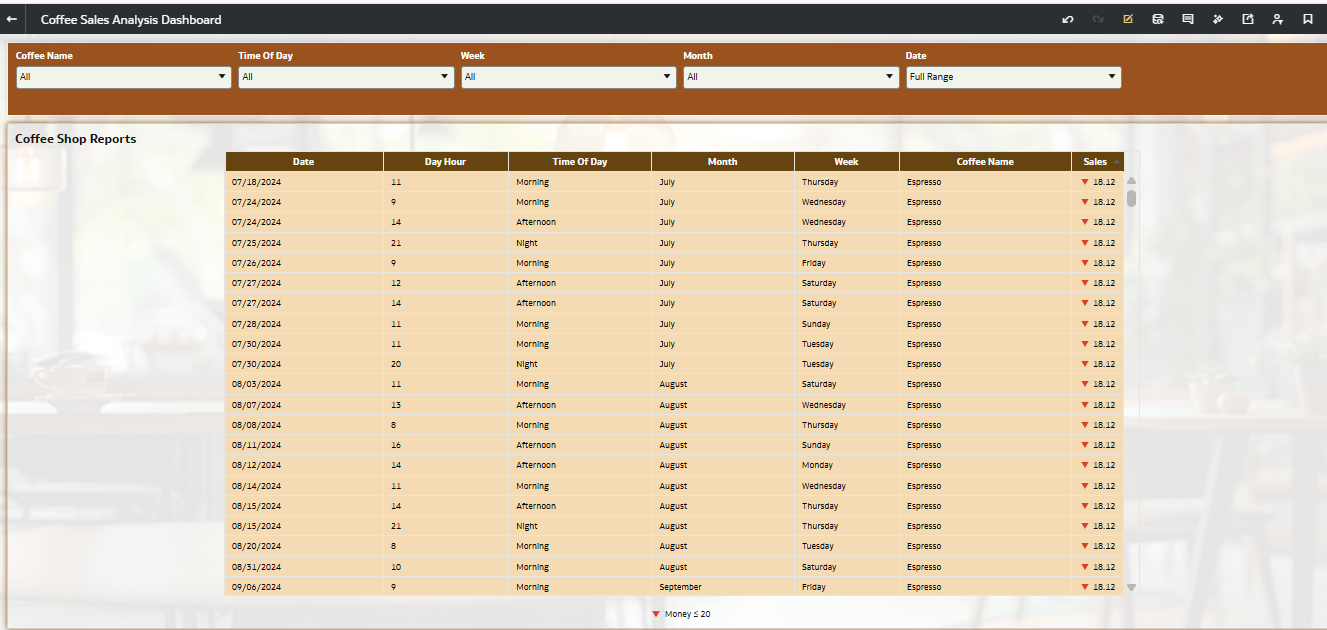
6. Did you upload your visualization image and DVA file?
Yes:
- The dashboard image has been prepared for presentation
- The DVA (Data Visualization Application) file is available for:
- Reusability
- Interview demonstrations
- Future enhancements