1. Which dataset did you use?
Datasets provided by IUCN
2. How did you analyze or prepare the data?
I used the AI Assistant
3. Who is the intended audience for your visualization?
Anyone who has an interest in protecting endangered and threatened animal species
4. What is your visualization about, and what question or problem does it address?
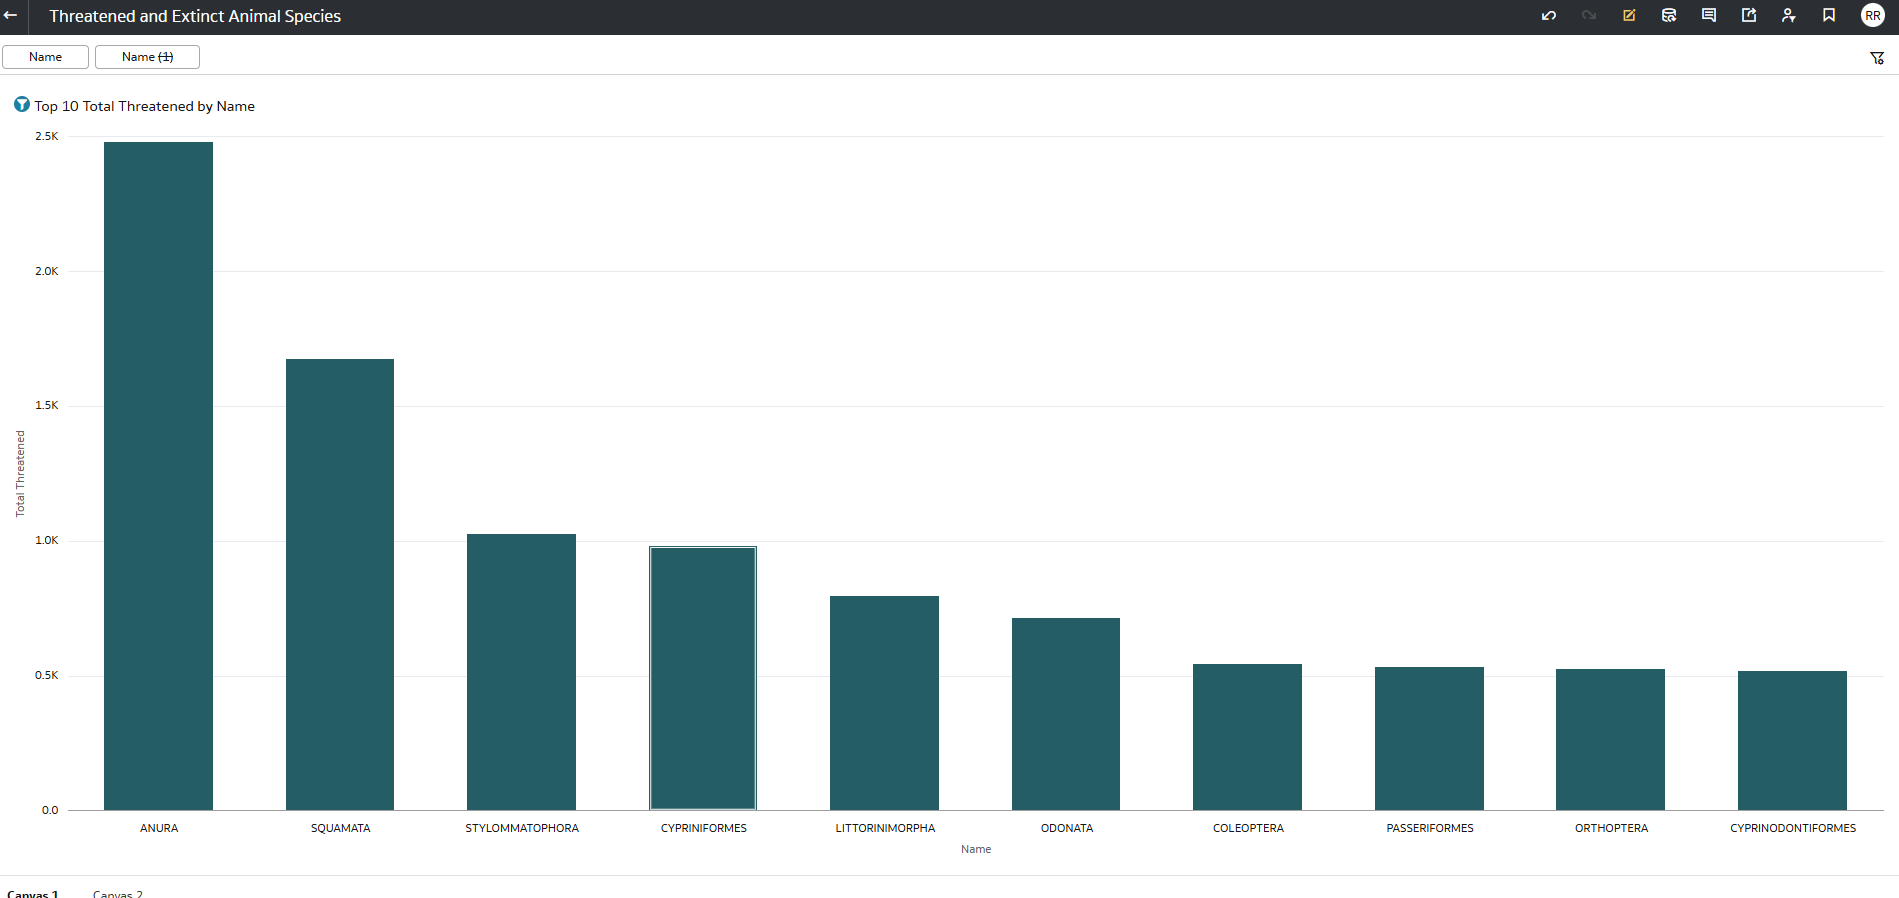
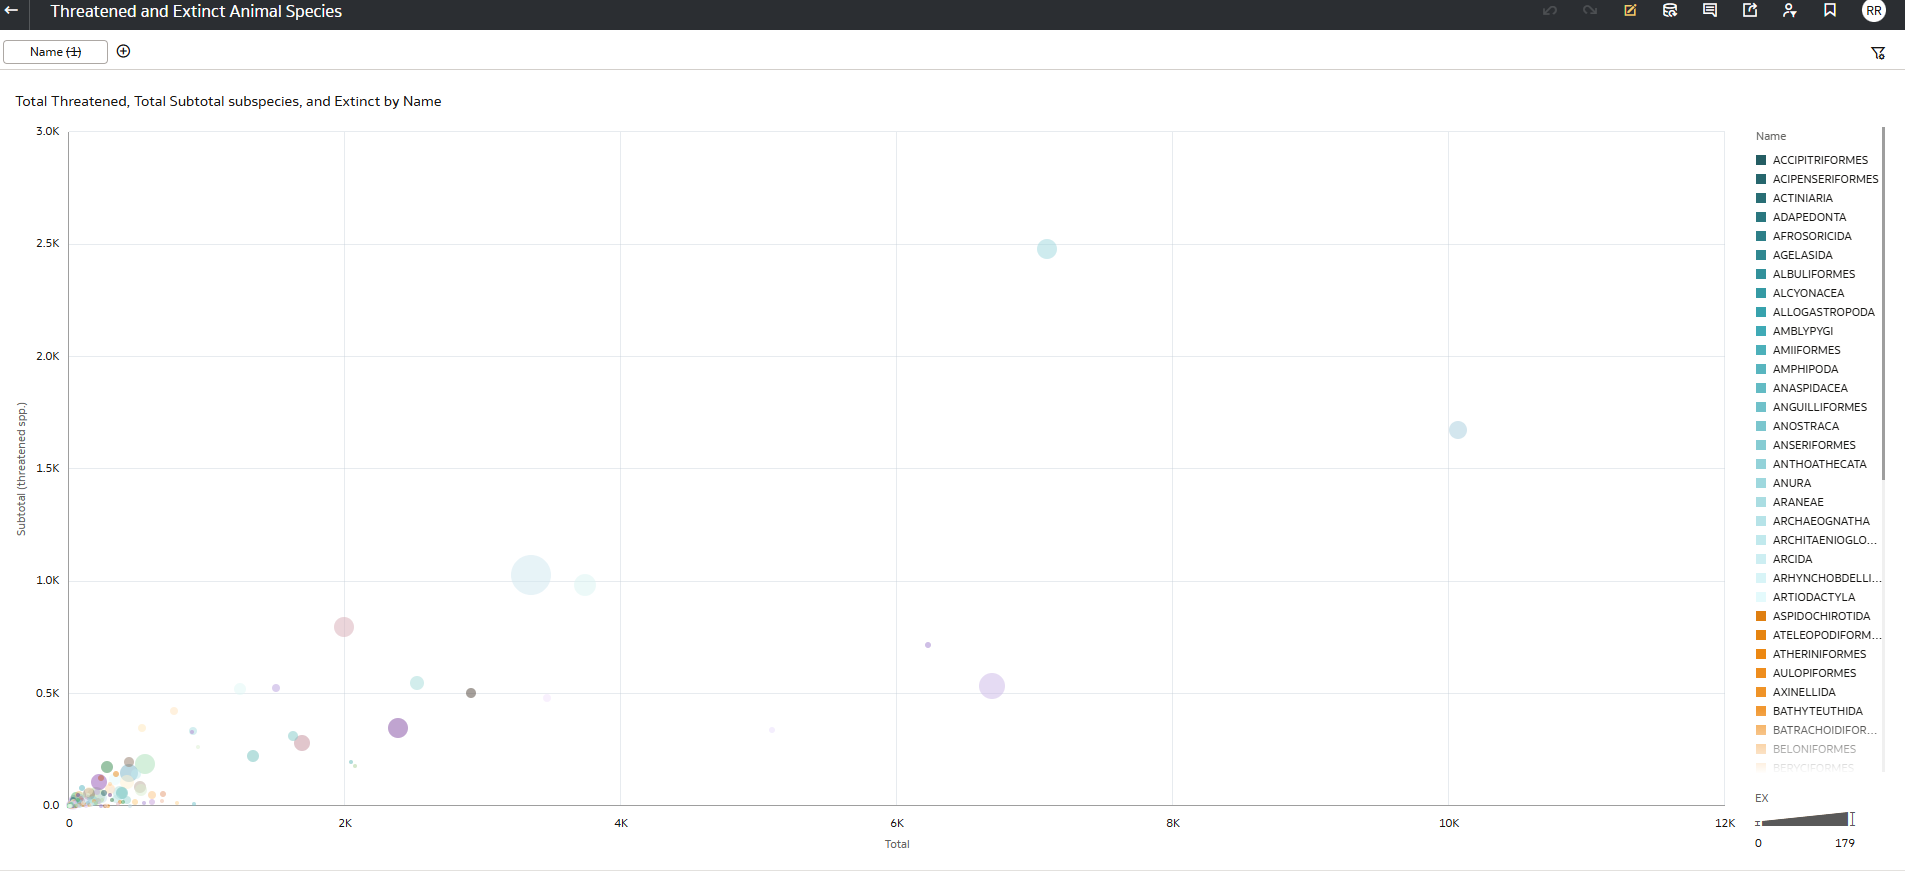
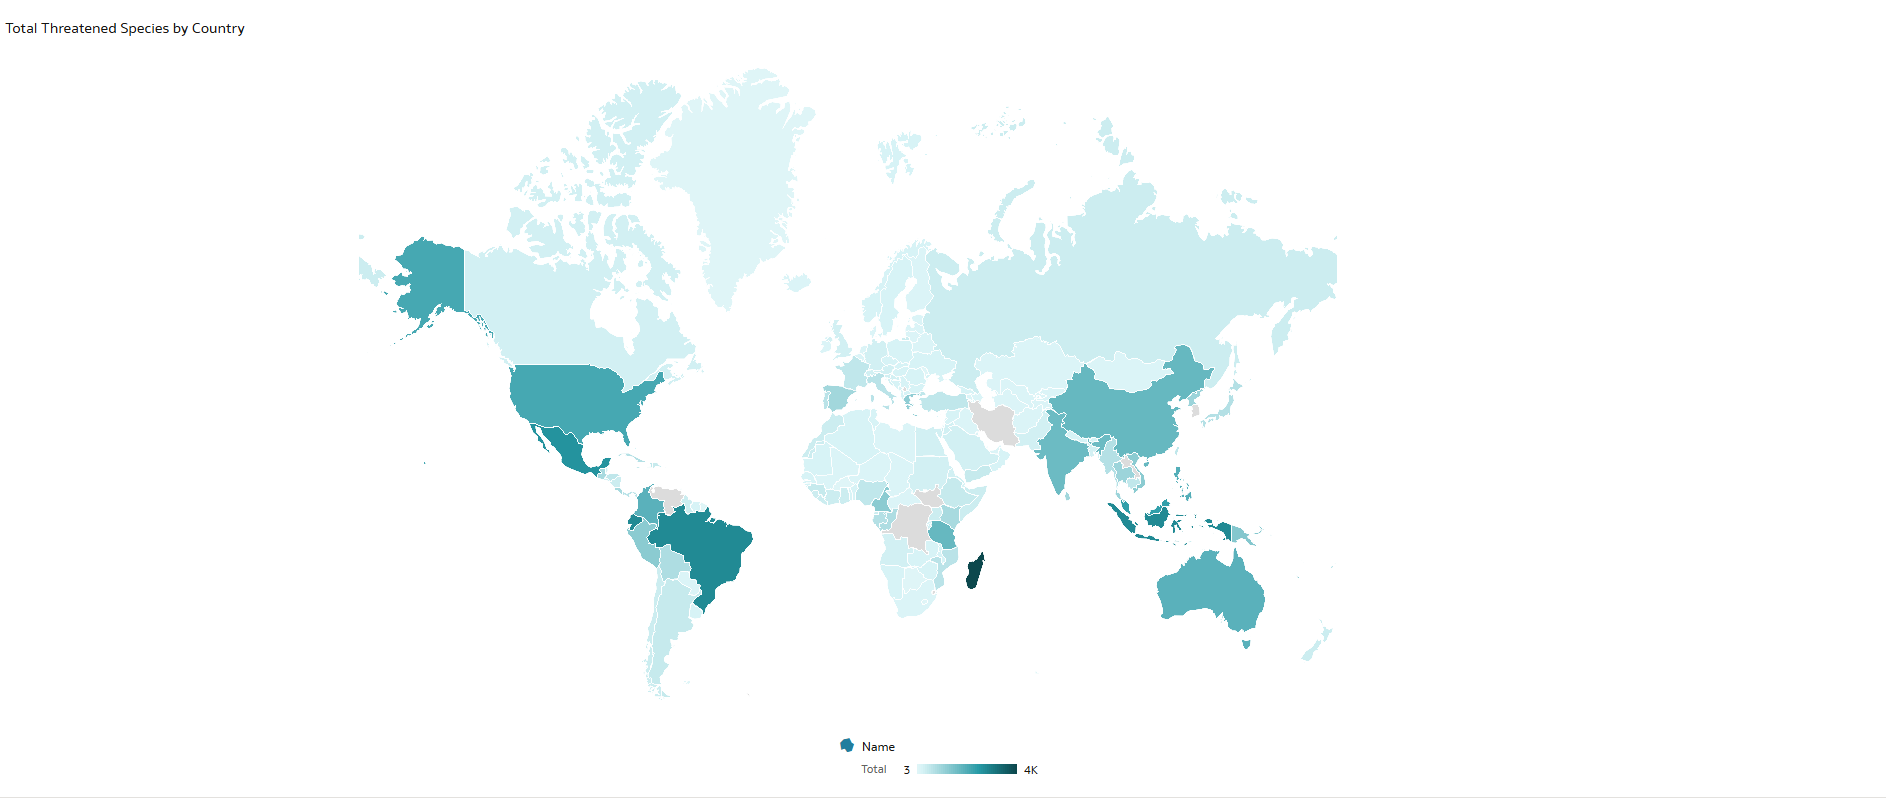
My data visualizations show animal species that are extinct or threatened and gives the top 10 by species and then a heat map showing the same. The other data visualization shows you the total threatened species by country.
5. Did you use any Oracle Analytics AI features when building your visualization (ex. AI Assistant)? If so, please describe how they were used
Yes, I used the AI Assistant in looking at my data and helping confirm the proper visualizations
6. Did you upload your visualization image and dva file?
Yes