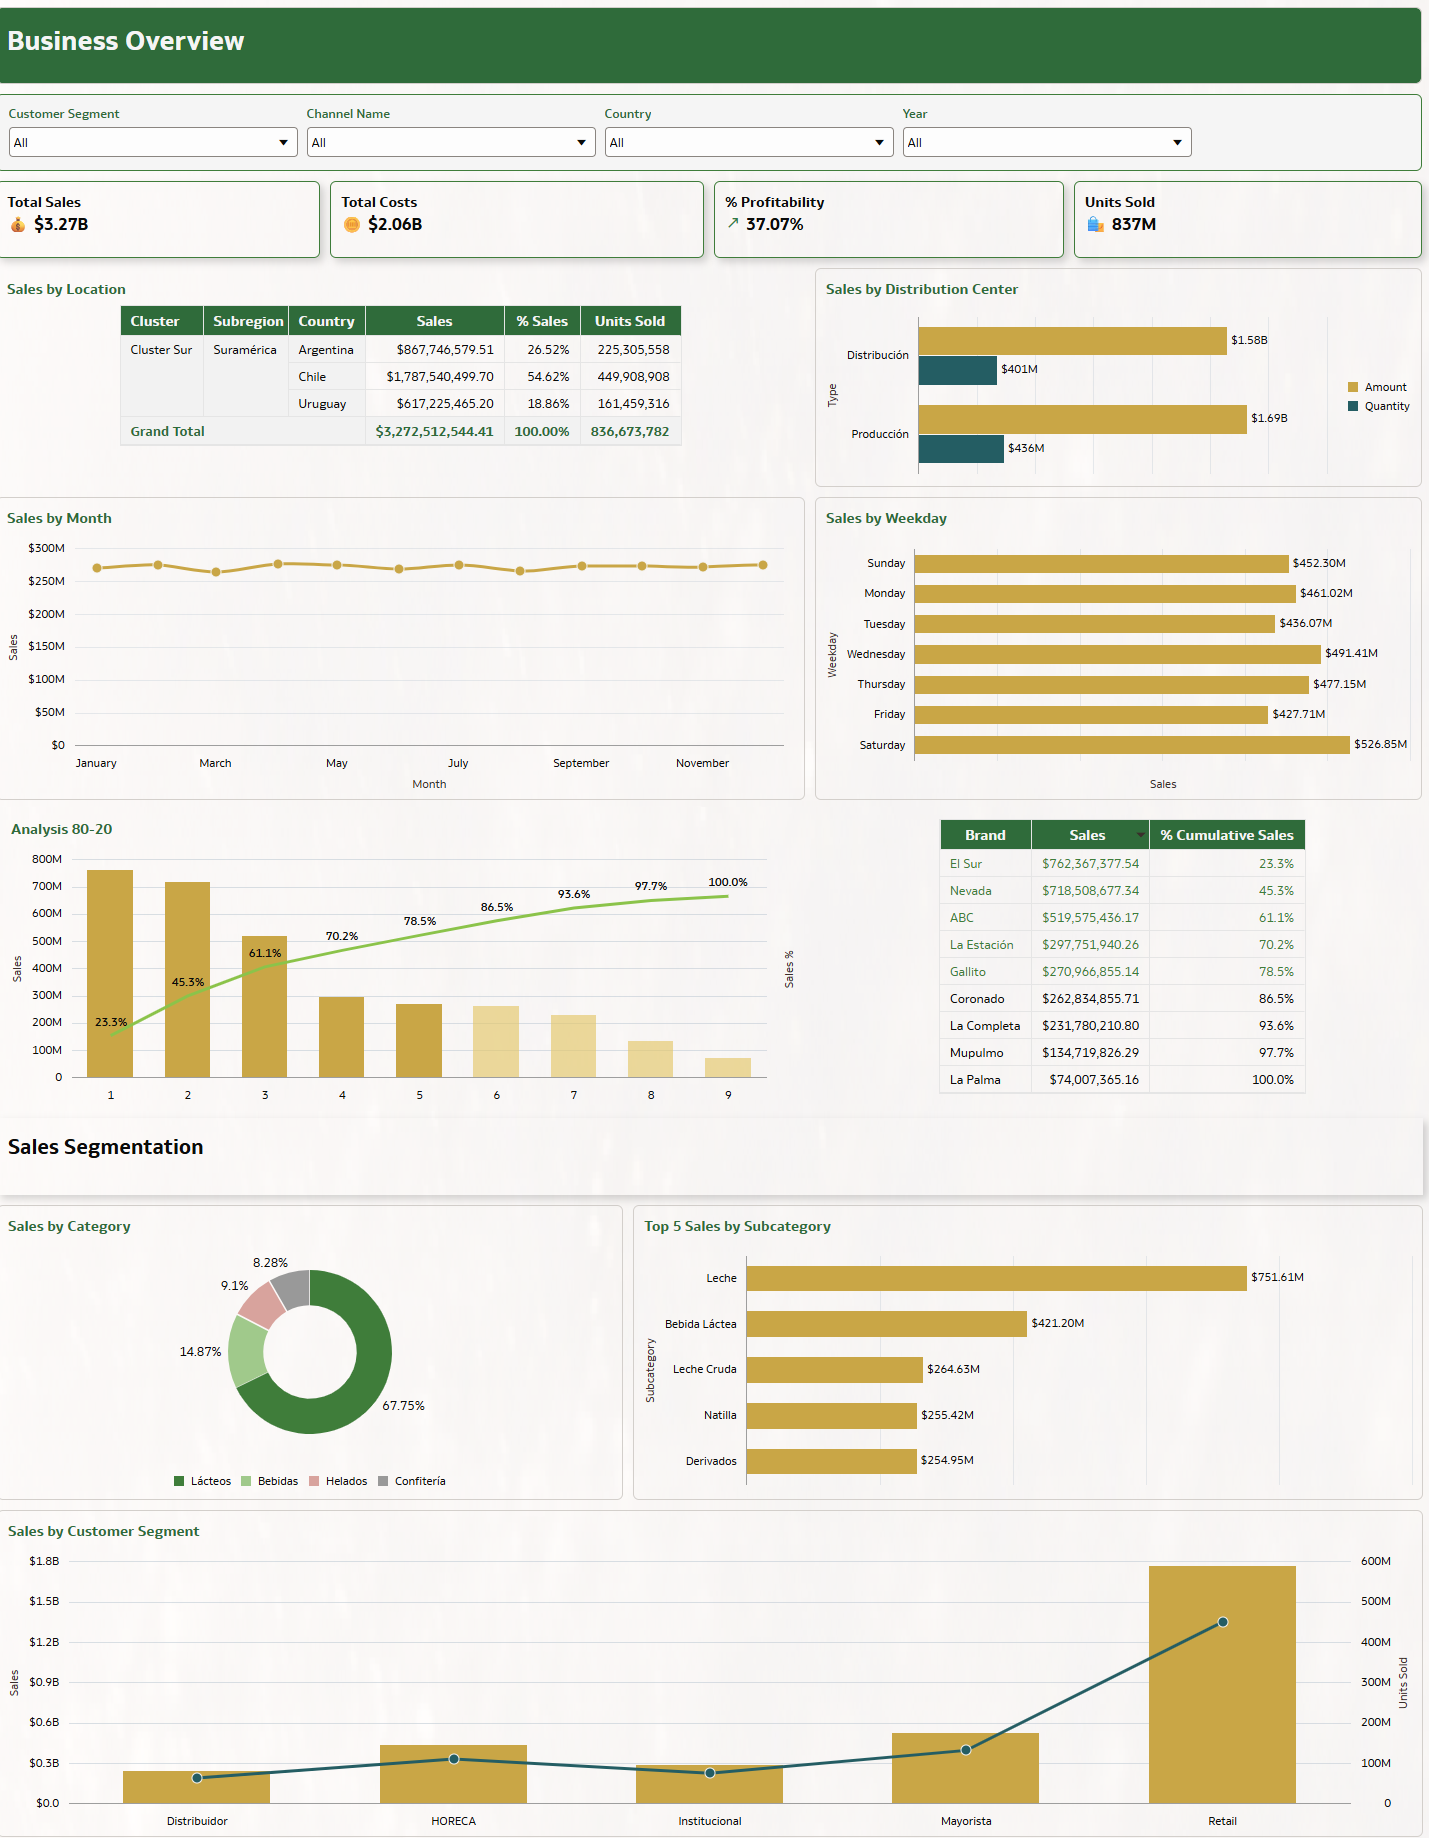
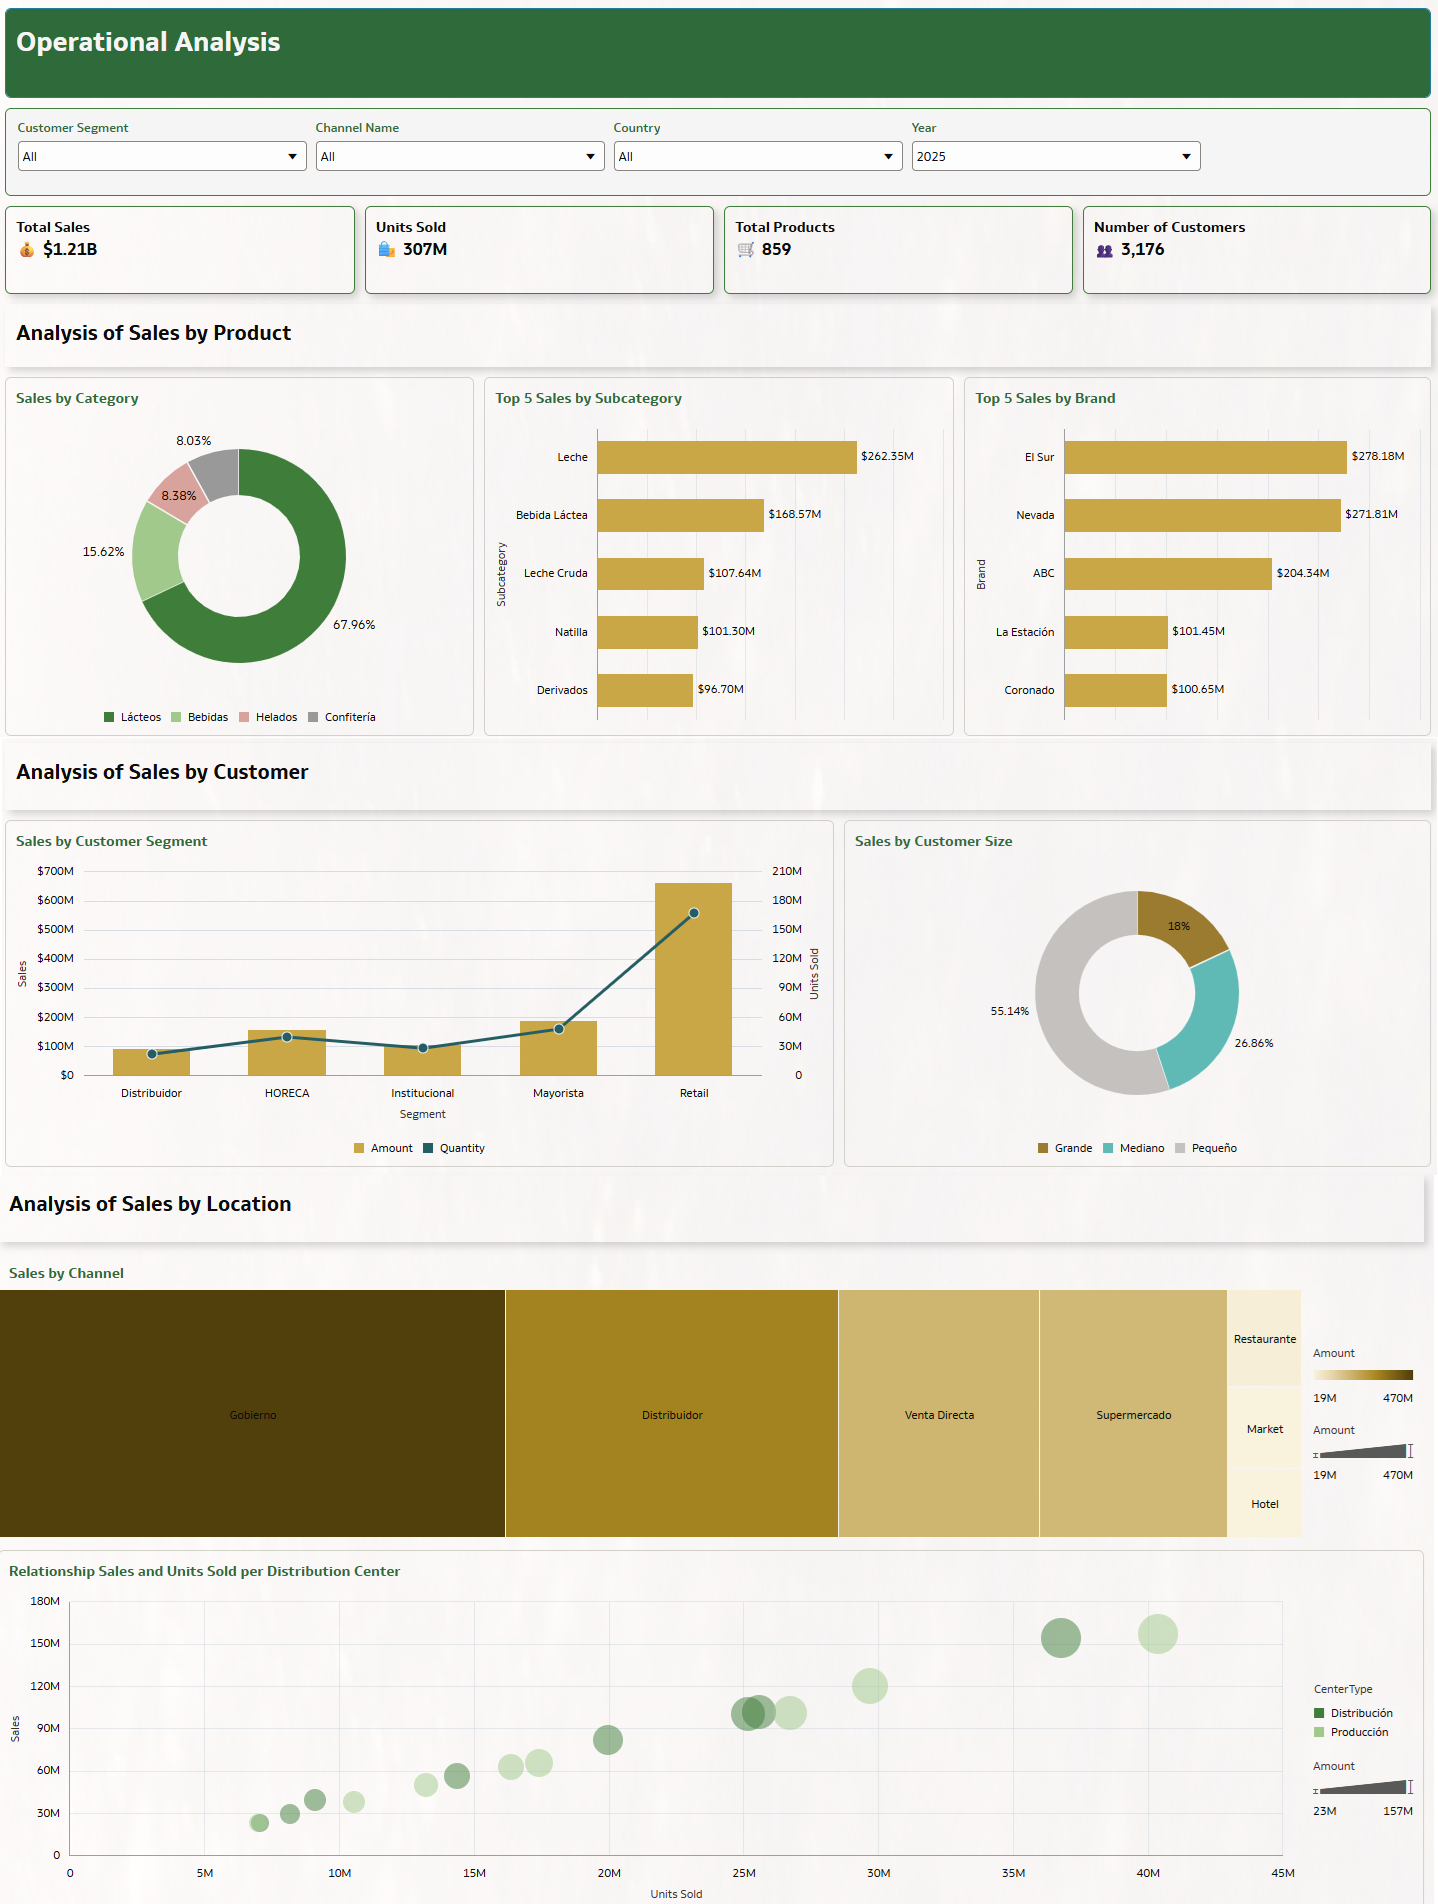
These dashboards provide a comprehensive view of sales performance across products, customers, channels, and regions. It enables business and operations leaders to identify key revenue drivers, understand demand patterns, and evaluate performance across multiple dimensions. The analysis supports data-driven decisions to optimize product strategy, channel focus, and market expansion.
1. Which dataset did you use?
I used a fictional dataset representing a dairy cooperative operating across multiple countries. The dataset follows a star schema model, including transactional sales data and supporting dimensions such as product, client, channel, location, distribution center, and calendar.
2. How did you analyze or prepare the data?
The dataset was already clean and structured. I performed a validation of the data model to ensure proper relationships (star schema) and consistency of dimensions and measures. Additionally, I reviewed key fields and aggregations to confirm they aligned with the intended analytical use cases.
3. Who is the intended audience for your visualization?
The dashboards are designed primarily for Business and Sales Managers, with a secondary audience including Operations teams.
The goal is to support both strategic decision-making and operational monitoring of sales performance.
4. What is your visualization about, and what question or problem does it address?
The visualization focuses on analyzing sales performance across products, channels, and regions. It addresses key business questions such as:
- Where is revenue being generated?
- Which products and channels drive the highest contribution?
- How is performance distributed across regions and customers?
The dashboards also enable deeper analysis through drill-down capabilities by customer, product, and location, supporting identification of key drivers and opportunities for growth.
5. Did you use any Oracle Analytics AI features when building your visualization (ex. AI Assistant)? If so, please describe how they were used.
Yes, I used Oracle Analytics AI-assisted features to explore and validate analytical approaches, specifically for implementing the Pareto (80/20) analysis. This helped identify the key contributors to revenue concentration and supported the design of a more insightful and business-focused visualization