by Raj Prakash
Learn about different types of memory access errors and how to detect them.
Introduction
Memory access errors represent one of the most pervasive, hard-to-detect, and most destructive types of programmer error. These errors happen when an application accesses memory that has not been initialized, is no longer valid, or is outside the bounds of the allowed area.
A classic example of this is the "Heartbleed" security flaw where a determined hacker could extract information from the internals of an application by requesting that the application return data past the end of an internal buffer.
In this article, we will discuss the types of memory access errors and the software tools available to detect them.
Examples of Memory Access Errors
There are essentially three major kinds of memory access errors:
- Using uninitialized memory
- Accessing freed memory
- Accessing past the end of allocated memory
Using Uninitialized Memory
Consider the code in Listing 1:
#include <stdio.h>
void printint(int *i)
{
printf("Integer = %i\n",*i);
}
void main()
{
int i;
printint(&i);
}
Listing 1.
The problem code declares a variable, and then later in the program flow, it reads from the memory location where the variable resides. It's important to note that the declaration and read are arbitrarily far apart, potentially in both the source code and in runtime. In this example, the variable resides on the stack, but it could also be held in memory allocated dynamically using malloc().
Accessing Freed Memory
Consider the code in Listing 2:
#include <stdio.h>
#include <stdlib.h>
void printint(int *i)
{
printf("Integer = %i\n", *i);
}
void main()
{
int * i = malloc(sizeof(int));
free(i);
printint(i);
}
Listing 2.
In Listing 2, we are allocating a buffer, freeing it, then reading from it. This is an interesting kind of error because the memory location might still be valid and might even contain the correct value, but on some occasions the buffer might have been reused by the time the invalid access takes place. If the buffer has already been reused, then reading from it will not return the expected result, and writing to it would cause data corruption. Of course, the time interval between the free() operation and the invalid access could be arbitrarily long, so it could be very hard to determine the actual cause of the error.
Accessing Past the End of Allocated Memory
A very common kind of error is where the access is past the end of the allocated region, as shown in Listing 3:
#include <stdio.h>
#include <stdlib.h>
void printarray(int *array, int len)
{
for (int i=0; i<len; i++)
{
printf("Index %i = %i\n", i, array[i]);
}
}
void main()
{
int * array = (int*) calloc(sizeof(int), 10);
printarray(array,11);
}
Listing 3.
In Listing 3, the code allocates a chunk of memory of sufficient size to hold 10 integers. This memory is passed into a function that prints out the elements in the array, but for demonstration purposes, the code attempts to access the eleventh element of the array.
Other Detectable Memory Errors
Beyond these three broad categories of memory errors, there are a large number of other detectable kinds of errors. It is useful to take a look at the list of errors detectable by the discover tool, which is available as part of the compiler suite of Oracle Solaris Studio.
These errors are problems such as double-freeing memory, passing a corrupt address to free, or passing overlapping addresses to memcpy() (which expects nonoverlapping addresses unlike memmove()).
Static Detection of Memory Access Errors Using Previse
There is a subset of memory access errors that can be detected at compile time. This is obviously the ideal time to provide a warning about these issues, because the developer will see the issue and have time to correct it before the application reaches the hands of the user. However, compile-time analysis is limited to those errors that can be determined by a careful analysis of a region of source code. The Oracle Solaris Studio Code Analyzer User's Guide has a list of the types of errors that can be identified through static analysis.
An example of the kind of error that can be identified through static analysis is the use of uninitialized data, as shown in Listing 4:
#include <stdio.h>
void main()
{
int i;
printf("i = %i\n", i);
}
Listing 4.
The reporting of these kinds of static errors is a two-step process. The first step is to compile the application with the flag -xprevise, which enables static analysis. The second step is to use one of the two tools that produce a report on the detected errors. The tool codean produces a textual report, and the Code Analyzer tool presents the data in a GUI. The output in Listing 5 shows compiling the code and seeing the textual report.
$ cc -g -xprevise uni.c
$ codean a.out
STATIC report of a.out:
ERROR 1 (UMR): accessing uninitialized data: i at:
main() <uni.c : 6>
3: void main()
4: {
5: int i;
6:=> printf("i = %i\n", i);
7: }
PREVISE SUMMARY for a.out: 1 error(s), 0 warning(s), 0 leak(s) in total
Listing 5.
Figure 1 shows the same report in the Code Analyzer GUI:
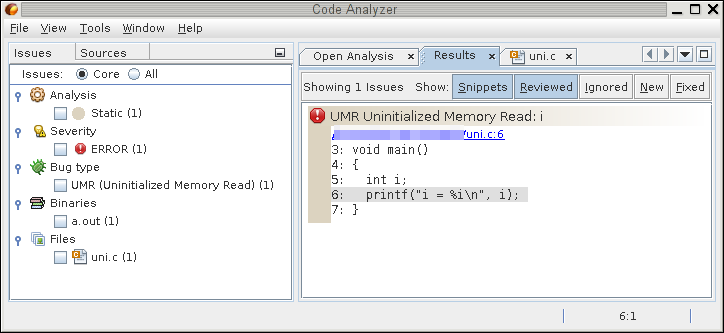
Figure 1. Report in the Code Analyzer GUI.
In the GUI, the type of error is shown as the title in the pane on the right, and the line containing the error is highlighted in gray.
Although static analysis is relatively limited in what it can achieve, it will report errors on all the previously shown code snippets. Consider the earlier code in Listing 1, which contains an access to an uninitialized variable. Listing 6 shows the error report.
ERROR 1 (UMR): accessing uninitialized data: i at:
main() <uninit.c : 11>
8: void main()
9: {
10: int i;
11:=> printint(&i);
12: }
PREVISE SUMMARY for a.out: 1 error(s), 0 warning(s), 0 leak(s) in total
Listing 6.
Note that the error is reported at the point where the variable is passed into the printint() routine. This is not a speculative error; the tool has actually looked into printint() and identified that the variable i is read there, and so passing in an uninitialized variable is an error. If the code is changed so that the variable is initialized in the routine, then the compiler no longer reports the function call as a problem. It is able to do this kind of detailed analysis because it can see the bodies of both the calling and called functions, and is, therefore, able to see both how the variable is initialized and how it is later used.
For code where there is an access to previously freed memory, the tool reports both the location of the access and the location where the memory was freed. This greatly helps the developer find the problem in the program flow, and makes it much easier to resolve the issue. Listing 7 shows the part of the error report generated for the code in Listing 2.
WARNING 1 (FMR): reading from freed memory: i at:
main() <freed.c : 13>
10: {
11: int * i = malloc(sizeof(int));
12: free(i);
13:=> printint(i);
14: }
was freed at:
main() <freed.c : 12>
9: void main()
10: {
11: int * i = malloc(sizeof(int));
12:=> free(i);
13: printint(i);
Listing 7.
However, this is not the only issue that the tool picks up in this code. It also identifies a missing check for malloc() returning a null pointer, as shown in Listing 8. This missing return error is quite common in code, and it is relatively easy for the compiler to identify. It is worth noting that in the event of an error, the program should check the errno variable to determine whether whether the error condition is fatal or indicates an action that should be retried. In the case of malloc(), it is possible for the OS to report that it currently has insufficient memory available, but the program should retry the allocation operation with the expectation that more memory will have been made available.
WARNING 2 (MRC): missing null-pointer check after malloc: malloc(4) at:
main() <freed.c : 11>
7: }
9: void main()
10: {
11:=> int * i = malloc(sizeof(int));
12: free(i);
PREVISE SUMMARY for ./a.out: 0 error(s), 2 warning(s), 0 leak(s) in total
Listing 8.
The earlier example in Listing 3, which shows an access past array bounds, is too complex for the tool to diagnose, because the bounds checking would require the tool to iterate through the loop, so detecting this error would require dynamic checking of the code. However, the tool does pick up two other issues with the code. Listing 9 shows that, once again, the code contains no check of the return from malloc(). The second issue is that the tool detects a memory leak where the allocated memory is not freed.
LEAK 1 : 1 block left allocated on heap with a total size of 4 bytes
main() <array.c : 14>
10: }
12: void main()
13: {
14:=> int * array = (int*) calloc(sizeof(int), 10);
15: printarray(array,11);
WARNING 1 (MRC): missing null-pointer check after malloc: calloc(4,10) at:
main() <array.c : 14>
10: }
12: void main()
13: {
14:=> int * array = (int*) calloc(sizeof(int), 10);
15: printarray(array,11);
PREVISE SUMMARY for ./a.out: 0 error(s), 1 warning(s), 1 leak(s) in total
Listing 9.
It is impossible for static analysis of applications to identify all the errors that exist in an application. The risk is that more-extensive static analysis of the code might end up raising many false positives. However, there are a surprising number of real errors that can be identified. The big advantage of using this kind of detection is that it all happens at compile time long before any users have had the chance to try the code.
Detecting Dynamic Memory Access Errors Using discover
Although a subset of memory access errors can be detected at compile time, the majority can be detected only at runtime. Some memory error conditions, such as double-freeing, can be detected using a light veneer of functionality over the existing library functions. Other memory access errors can be detected only through a deep instrumentation of the target application.
Oracle Solaris Studio provides the tool discover to do both light and deep analysis of memory access errors in a target application.
Light instrumentation of library calls has a very small impact on the performance of an application; most applications continue to run at essentially normal speeds. The weakness of this level of analysis is that it catches problems only at the function call level. Consider the code in Listing 10:
#include <stdlib.h>
void main()
{
char * string = (char*)malloc(1024);
free(string);
free(string);
}
Listing 10.
This code performs a double free() of allocated memory. Of course, given that both calls are in the same scope, a static check of the code would also pick up the error. However, most errors of this kind occur in more-complex code sequences.
Double-freeing is one of the errors that can be picked up with a light instrumentation of an application's library calls. To perform a light instrumentation, we compile the binary, and then process the resulting binary with the tool discover, which produces an instrumented version of the application that can then be run. If the -l command-line option is passed to discover, it instruments only the library calls. Listing 11 shows the results of this instrumentation:
$ cc -g double.c
$ discover -l -w - ./a.out
$ ./a.out
ERROR 1 (DFM): double freeing memory "*string" at address 0x40560 at:
main() + 0x20 <double.c:7>
4: {
5: char * string = (char*)malloc(1024);
6: free(string);
7:=> free(string);
8: }
9:
_start() + 0x108
was allocated at (1024 bytes):
main() + 0x4 <double.c:5>
2:
3: void main()
4: {
5:=> char * string = (char*)malloc(1024);
6: free(string);
7: free(string);
8: }
_start() + 0x108
freed at:
main() + 0x14 <double.c:6>
3: void main()
4: {
5: char * string = (char*)malloc(1024);
6:=> free(string);
7: free(string);
8: }
9:
_start() + 0x108
***************** Discover Memory Report *****************
No allocated memory left on program exit.
DISCOVER SUMMARY:
unique errors : 1 (1 total)
unique warnings : 0 (0 total)
Listing 11.
The report produced for the double-freeing operation indicates where the second free operation occurred. It also helpfully points out where the memory was allocated and where it was first freed. This should enable most developers to reconstruct the program flow that led to the double-freeing error.
In Listing 11, we also passed the option -w - to discover. This tells discover to produce a report to stderr. Without this, the default is to produce an HTML report that can be examined in a web browser.
If an application is compiled with Oracle Solaris Studio, discover can do a far deeper analysis of memory access errors. The tool actually adds instrumentation code into every memory operation, and this instrumentation checks whether each memory access is valid or not. The downside of this degree of instrumentation is that it can have a considerable impact on runtime.
Uninitialized Memory
As an example of uninitialized memory, consider the earlier code in Listing 1, which had accessed uninitialized memory. Using discover, we get the report shown in Listing 12, which shows the location of the invalid memory access and the call stack that got us to that point.
$ cc -g uninit.c
$ discover -w - ./a.out
$ ./a.out
ERROR 1 (UMR): accessing uninitialized data at address 0xffbffba4 (4 bytes) on the stack at:
printint() + 0xa8 <uninit.c:5>
2:
3: void printint(int *i)
4: {
5:=> printf("Integer = %i\n",*i);
6: }
7:
8: void main()
main() + 0x20 >uninit.c:11>
8: void main()
9: {
10: int i;
11:=> printint(&i);
12: }
13:
_start() + 0x108
***************** Discover Memory Report *****************
No allocated memory left on program exit.
DISCOVER SUMMARY:
unique errors : 1 (1 total)
unique warnings : 0 (0 total)
Listing 12.
Access Past Array Bounds
Earlier, Listing 3 showed an example where the code accessed beyond the end of an array, as depicted in Figure 2.
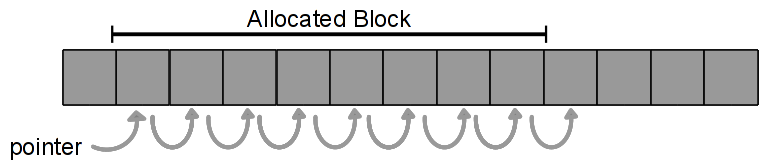
Figure 2. Accessing beyond the end of an array.
The discover tool can diagnose using deep memory-access checking, as shown in Listing 13.
-bash-4.1$ cc -g array.c
-bash-4.1$ discover -w - ./a.out
-bash-4.1$ ./a.out
ERROR 1 (ABR): reading memory beyond array bounds at address 0x40590 (4 bytes) on the heap at:
printarray() + 0x144 <array.c:8>
5: {
6: for (int i=0; i<len; i++)
7: {
8:=> printf("Index %i = %i\n", i, array[i]);
9: }
10: }
11:
main() + 0x74 <array.c:15>
12: void main()
13: {
14: int * array = (int*) calloc(sizeof(int), 10);
15:=> printarray(array,11);
16: }
17:
18:
_start() + 0x108
was allocated at (40 bytes):
main() + 0x20 <array.c:14>
11:
12: void main()
13: {
14:=> int * array = (int*) calloc(sizeof(int), 10);
15: printarray(array,11);
16: }
17:
_start() + 0x108
***************** Discover Memory Report *****************
1 allocation at 1 location left on the heap with a total size of 40 bytes
LEAK 1: 1 allocation with total size of 40 bytes
main() + 0x20 <array.c:14>
11:
12: void main()
13: {
14:=> int * array = (int*) calloc(sizeof(int), 10);
15: printarray(array,11);
16: }
17:
_start() + 0x108
DISCOVER SUMMARY:
unique errors : 1 (1 total)
unique warnings : 0 (0 total)
Listing 13.
The discover tool is also able to report memory leaks. In this instance, discover is reporting that 40 bytes were left on the heap.
Access to Previously Freed Memory
Instrumentation can easily detect situations, such as the one shown in Figure 3, where there is an access to previously freed memory.
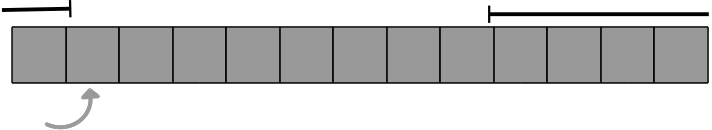
Figure 3. Accessing previously freed memory.
Because discover instruments the binary, it can point out the exact place in the code where the previously freed memory is accessed, and it can indicate where the memory was allocated and where it was freed, as shown in Listing 14.
-bash-4.1$ cc -g freed.c
-bash-4.1$ discover -w - ./a.out
-bash-4.1$ ./a.out
ERROR 1 (FMR): reading from freed memory at address 0x50010 (4 bytes) on the heap at:
printint() + 0xa8 <freed.c:6>
3:
4: void printint(int *i)
5: {
6:=> printf("Integer = %i\n", *i);
7: }
8:
9: void main()
main() + 0x78 <freed.c:13>
10: {
11: int * i = malloc(sizeof(int));
12: free(i);
13:=> printint(i);
14: }
15:
_start() + 0x108
was allocated at (4 bytes):
main() + 0x1c <freed.c:11>
8:
9: void main()
10: {
11:=> int * i = malloc(sizeof(int));
12: free(i);
13: printint(i);
14: }
_start() + 0x108
freed at:
main() + 0x6c <freed.c:12>
9: void main()
10: {
11: int * i = malloc(sizeof(int));
12:=> free(i);
13: printint(i);
14: }
15:
_start() + 0x108
Integer = 327704
***************** Discover Memory Report *****************
No allocated memory left on program exit.
DISCOVER SUMMARY:
unique errors : 1 (1 total)
unique warnings : 0 (0 total)
Listing 14.
Conclusion
Memory access errors are a subtle and hard-to-detect group of bugs. Their consequences can be severe. In the case of the Heartbleed bug, the problem was not that data was corrupted; rather, it was that data was exposed. Data corruption often causes applications to crash or behave in unpredictable ways, which, in many instances, makes the problem easier to detect and, therefore, easier to fix. Exposing data is less likely to cause the application to show symptoms of a problem, so that can go undetected for longer.
Memory access errors are best detected using runtime analysis of the application, although some errors might be detectable from a careful static analysis of the code. Oracle Solaris Studio has tools for both static and dynamic detection of memory access errors.
See Also
Using Silicon Secured Memory to Detect Memory Access Errors at Hardware Speeds
About the Author
Raj Prakash is a senior software architect at Oracle. Currently he is the technical lead for several code analysis tools and global optimizers. His expertise is in developing tools designed to improve application security, performance, and scalability. He also writes a blog.
| Revision 1.0, 03/03/2016 |
Follow us:
Blog | Facebook | Twitter | YouTube