Hi,
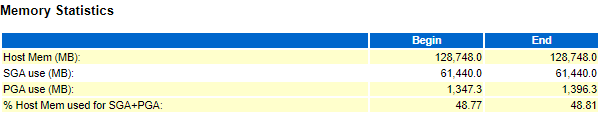
We have a 12.1.0.2. NO RAC database on Linux X86 64-bit 16 CPUu Cores and 125 Go Memory
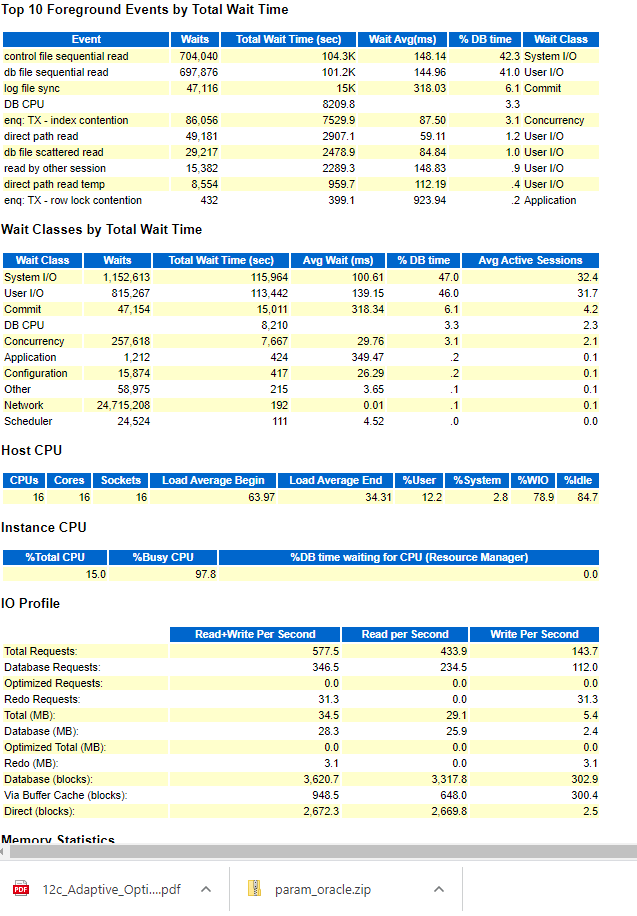
Looking at the "top 5 timed events" section of the AWR reports (always for 1 hour), I am seeing "control file sequential read" as the number one event
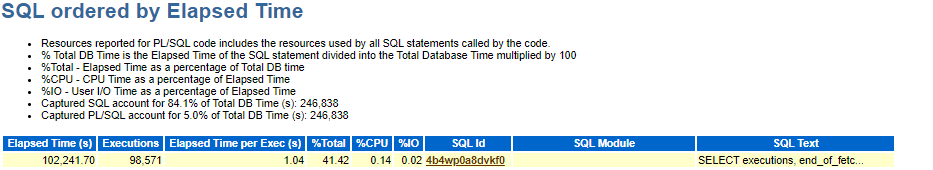
SELECT executions, end_of_fetch_count, elapsed_time/px_servers elapsed_time, cpu_time/px_servers cpu_time, buffer_gets/executions buffer_gets FROM (SELECT sum(executions_delta) as EXECUTIONS, sum(case when px_servers_execs_delta > 0 then px_servers_execs_delta else executions_delta end) as px_servers, sum(end_of_fetch_count_delta) as end_of_fetch_count, sum(elapsed_time_delta) as ELAPSED_TIME, sum(cpu_time_delta) as CPU_TIME, sum(buffer_gets_delta) as BUFFER_GETS FROM DBA_HIST_SQLSTAT s, V$DATABASE d, DBA_HIST_SNAPSHOT sn WHERE s.dbid = d.dbid AND bitand(nvl(s.flag, 0), 1) = 0 AND sn.end_interval_time > (select systimestamp at TIME ZONE dbtimezone from dual) - 7 AND s.sql_id = :1 AND s.snap_id = sn.snap_id AND s.instance_number = sn.instance_number AND s.dbid = sn.dbid AND parsing_schema_name = :2)
How can identified the origin of my issue ?
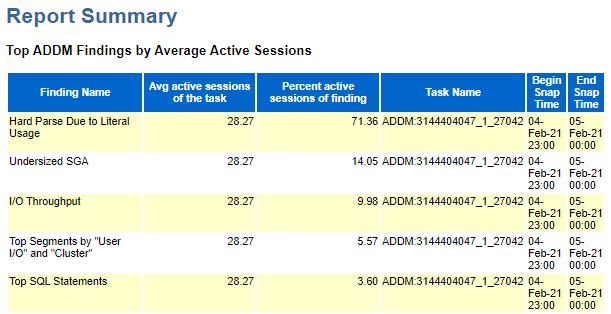
I saw that that SQl ID is used by the new feature Adapative Dynamic Statc, and it is on the top 10 ordered by Elapsed time during 3 one hour snap
The ADDM expose enhard parsing issue and undersized DGA