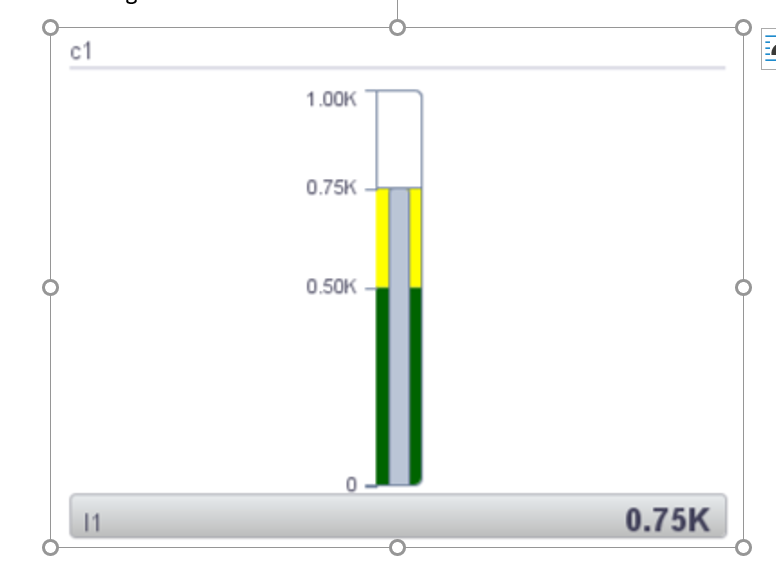
how to display Column Values, Legends,Changing Font and Font Size in Gauge Graph in the advanced html code displayed as below picture
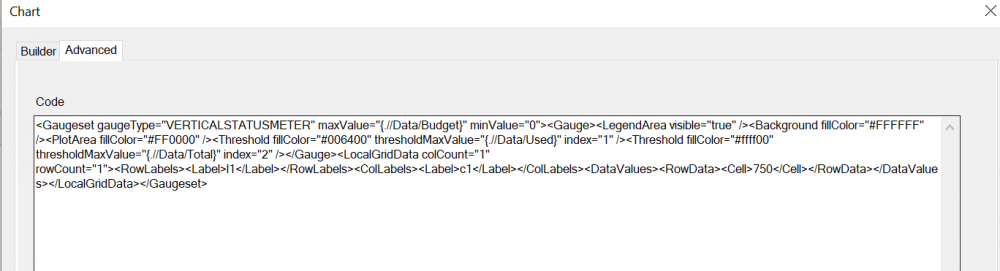 (<Gaugeset gaugeType="VERTICALSTATUSMETER" maxValue="{.//Data/Budget}" minValue="0"><Gauge><LegendArea visible="true" /><Background fillColor="#FFFFFF" /><PlotArea fillColor="#FF0000" /><Threshold fillColor="#006400" thresholdMaxValue="{.//Data/Used}" index="1" /><Threshold fillColor="#ffff00" thresholdMaxValue="{.//Data/Total}" index="2" /></Gauge><LocalGridData colCount="1" rowCount="1"><RowLabels><Label>l1</Label></RowLabels><ColLabels><Label>c1</Label></ColLabels><DataValues><RowData><Cell>750</Cell></RowData></DataValues></LocalGridData></Gaugeset>)