Hi,
Recently I tried Adrian Billington's mystats.sql utility in SQLcl, in order to collect session's statistics.
(The web page for Adrian Billington's utilities for Oracle developers is here; the source code of the mystats.sql script is here.)
Actually, for reasons explained in this post, I used a slightly modified version of the original script, in order to specify explicit paths for spool files.
Given that the mystats.sql script is not only clever, but also very simple, I expected it to run within the blink of an eye, and I was very disappointed: using SQLcl, it took a noticeably long time to run the following:
SQL> @mystats start s=s,t

PL/SQL procedure successfully completed.
How long? More than 1 full second, perhaps 2 seconds... I didn't time it exactly, but it was long enough to warrant a quick performance investigation, all the more so as running the same in SQL*Plus did not take longer than the blink of an eye—so there was a huge feeling of a performance difference here.
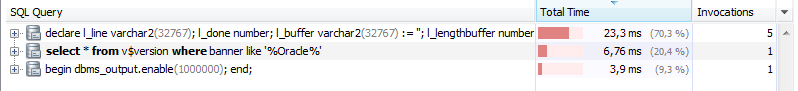
Using the JDBC Profiler in VisualVM, the culprit was found out quickly, as you may see in the following screenshot:
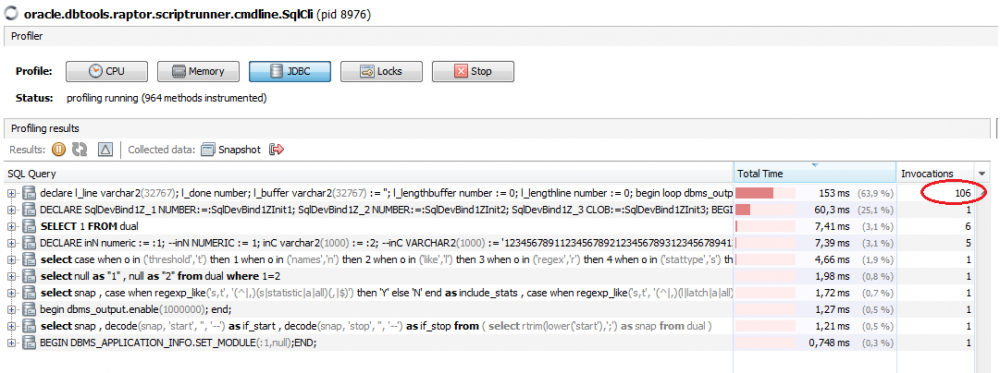 The JDBC Profiler lists statements in decreasing order of total (elapsed) time. The first statement in the list is the one in which the most time was spent. On the above screenshot you may see that this statement was executed 106 times, for a total of 153 ms.
(Remark: please do not pay attention to the timings in the above screenshot: it was taken on a test computer with the database running in a local virtual machine, so here the client-server latency is very quick, in the 1 ms ballpark... But picture yourself in a different, real-world customer site, with a remote database and a client-server latency closer to 10 ms, and then the above 153 ms expand to no fewer than 1.5 second... and that feels slow.)
The SQL id for this statement (which you may find by tracing the session) is 5yaurap8h97nx, and it reads as follows:
declare
    l_line varchar2(32767);
    l_done number;
    l_buffer varchar2(32767) := '';
    l_lengthbuffer number := 0;
    l_lengthline number := 0;
begin
  loop
    dbms_output.get_line( l_line, l_done );
    if (l_buffer is null) then
      l_lengthbuffer := 0;
    else
      l_lengthbuffer := length(l_buffer);
    end if;
    if (l_line is null) then
      l_lengthline := 0;
    else
      l_lengthline := length(l_line);
    end if;
  exit when l_lengthbuffer + l_lengthline > :maxbytes OR l_lengthbuffer + l_lengthline > 32767 OR l_done = 1;
  l_buffer := l_buffer || l_line || chr(10);
    end loop;
    :done := l_done;
    :buffer := l_buffer;
    :line := l_line;
end;
Yes, that's the PL/SQL block used by SQLcl / SQL Developer to fetch lines from DBMS_OUTPUT's internal buffer once SERVEROUTPUT has been switched to ON.
(In the session trace file, it appeared that the value of the :maxbytes input bind variable was equal to 1000.)
But wait! There's exactly 1 and only 1 PL/SQL block in the mystats.sql script. (And SQLcl wraps it into what appears as the 2nd statement in the JDBC profile; that block was executed only once, with an elapsed time of 60.3 ms above). And further, there was no output line to be fetched at all: as shown above, @mystats start does not output anything (the readout comes with @mystats stop). So why had SQLcl executed the output-fetching statement (SQL id: 5yaurap8h97nx) 106 times?
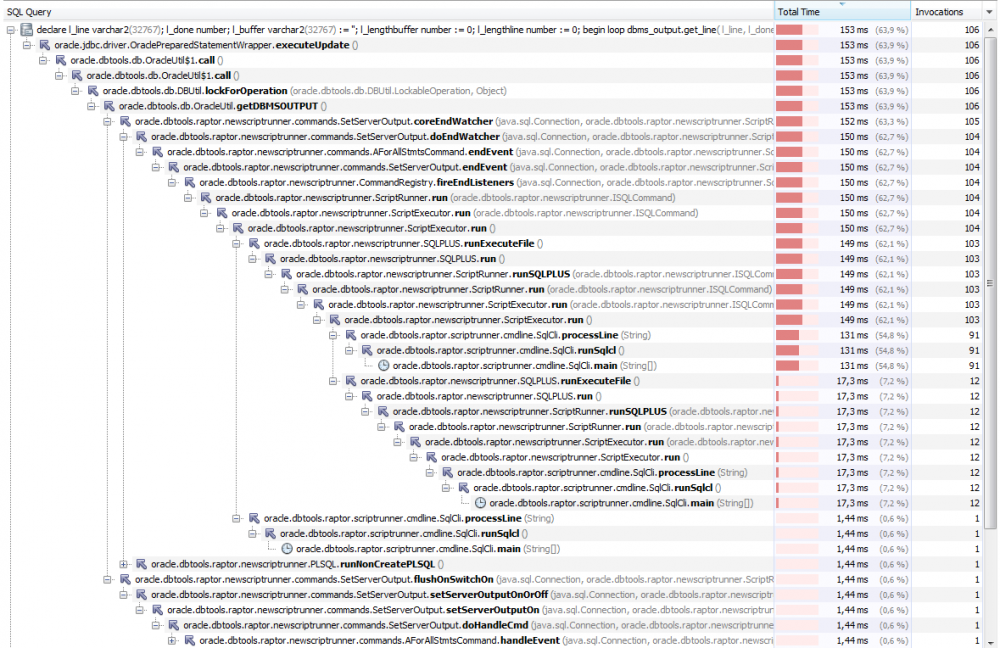
The JDBC Profiler includes the call stacks for each JDBC statement call; this enables to figure out where in the client application JDBC calls are originating from. The following screenshot shows the call stacks in their full glory—just to briefly lift the veil and see how complex the implementation may be...
 Humm... Let's try something simpler here.
E:\Home\user9540031\Temp> sqlcl /nolog

SQLcl: Release 22.1 Production on Sun Jun 12 16:39:00 2022
Copyright (c) 1982, 2022, Oracle.  All rights reserved.

SQL> connect scott@pdb_rva
Password? (**********?) *****
Connected.
Now restart the JDBC Profiler.
(Remark: SQLcl's JVM barks about illegal reflective accesses:
SQL> Profiler Agent: JNI OnLoad Initializing...
Profiler Agent: JNI OnLoad Initialized successfully
Profiler Agent: Waiting for connection on port 5140 (Protocol version: 20)
Profiler Agent: Established connection with the tool
WARNING: An illegal reflective access operation has occurred
WARNING: Illegal reflective access by org.graalvm.visualvm.lib.jfluid.server.ClassLoaderManager to method java.lang.ClassLoader.findLoadedClass(java.lang.String)
WARNING: Please consider reporting this to the maintainers of org.graalvm.visualvm.lib.jfluid.server.ClassLoaderManager
WARNING: Use --illegal-access=warn to enable warnings of further illegal reflective access operations
WARNING: All illegal access operations will be denied in a future release
Profiler Agent: Local accelerated session
*** Profiler engine warning: class jdk.internal.reflect.GeneratedMethodAccessor39 loaded by *** Profiler Agent Communication Thread
Meanwhile, profiling seems to work, so let's carry on with our tests.)
SQL> set serveroutput on
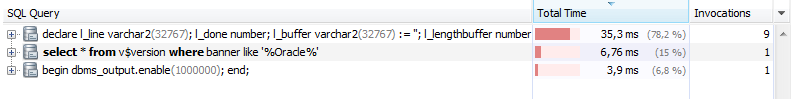
Now the JDBC profile reads as follows:
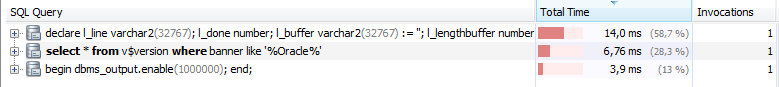 As you can see, the output-fetching statement (SQL id: 5yaurap8h97nx) has been called exactly once so far.
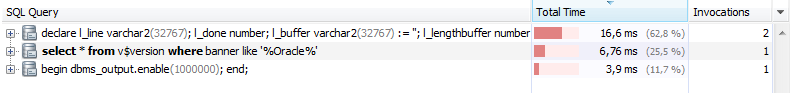
So let's type in a SQL*Plus command; note that this is a client-side only command, one which doesn't require any database call at all, in principle.
SQL> prompt test
test
Meanwhile... Surprise! SQLcl did make a database call:
 Let's carry on:
SQL> define def_sub = ""
<img src="https://objectstorage.us-phoenix-1.oraclecloud.com/p/BqK85Rn1zA5MP0vYiqbAdPgs7Z6OmMxw8SD3WCFVm5kY8uReidZ1KPIKkgJ1hCkG/n/axciphqpnohg/b/forums-legacy/o/uploads/8VMXCW6H77Z1/sqlcl-jdbc-profile-03-after-define.png" alt="sqlcl-jdbc_profile-03-after_define.png">SQL> column c1 format a10
<img src="https://objectstorage.us-phoenix-1.oraclecloud.com/p/BqK85Rn1zA5MP0vYiqbAdPgs7Z6OmMxw8SD3WCFVm5kY8uReidZ1KPIKkgJ1hCkG/n/axciphqpnohg/b/forums-legacy/o/uploads/MR87ITCEMJXV/sqlcl-jdbc-profile-04-after-column.png" alt="sqlcl-jdbc_profile-04-after_column.png">SQL> set verify off
 Do you see a pattern here?
SQL> undefine def_sub
SQL> column c1 clear
SQL> spool temp.out
SQL> spool off
 All the above commands are client-side only commands: they do not make, nor require, any call to the database, so it seems obvious that they should not cause any change to the contents of the DBMS_OUTPUT buffer. So why is SQLcl trying to fetch more output lines?
So there you have it: when SERVEROUTPUT is ON, SQLcl makes a database call to get new lines from the DBMS_OUTPUT buffer after each and every command, even commands which do not make any call to the database.
And if running elaborate SQL*Plus scripts, such as Adrian Billington's mystats.sql utility (which is far from sophisticated by the way, but uses many SQL*Plus client-side commands such as COLUMN, DEFINE, UNDEFINE, etc.) and the database client-server latency is high, say 10 ms or more, this behaviour results in scripts being noticeably slower in SQLcl than they are in SQL*Plus, due to the many additional client-server round-trips.
Workaround: issue the SET SERVEROUTPUT ON command just before running the output-generating PL/SQL block(s), and call SET SERVEROUTPUT OFF as soon as possible afterwards.
(This is the opposite of the common usage, which consists of placing the SET SERVEROUTPUT ON command at the very beginning of any script using DBMS_OUTPUT... )